Demos
Two recordings, each of a dataset from Example datasets on the home screen, opened as its publisher serves it. Every step they show is written out in the guides below.
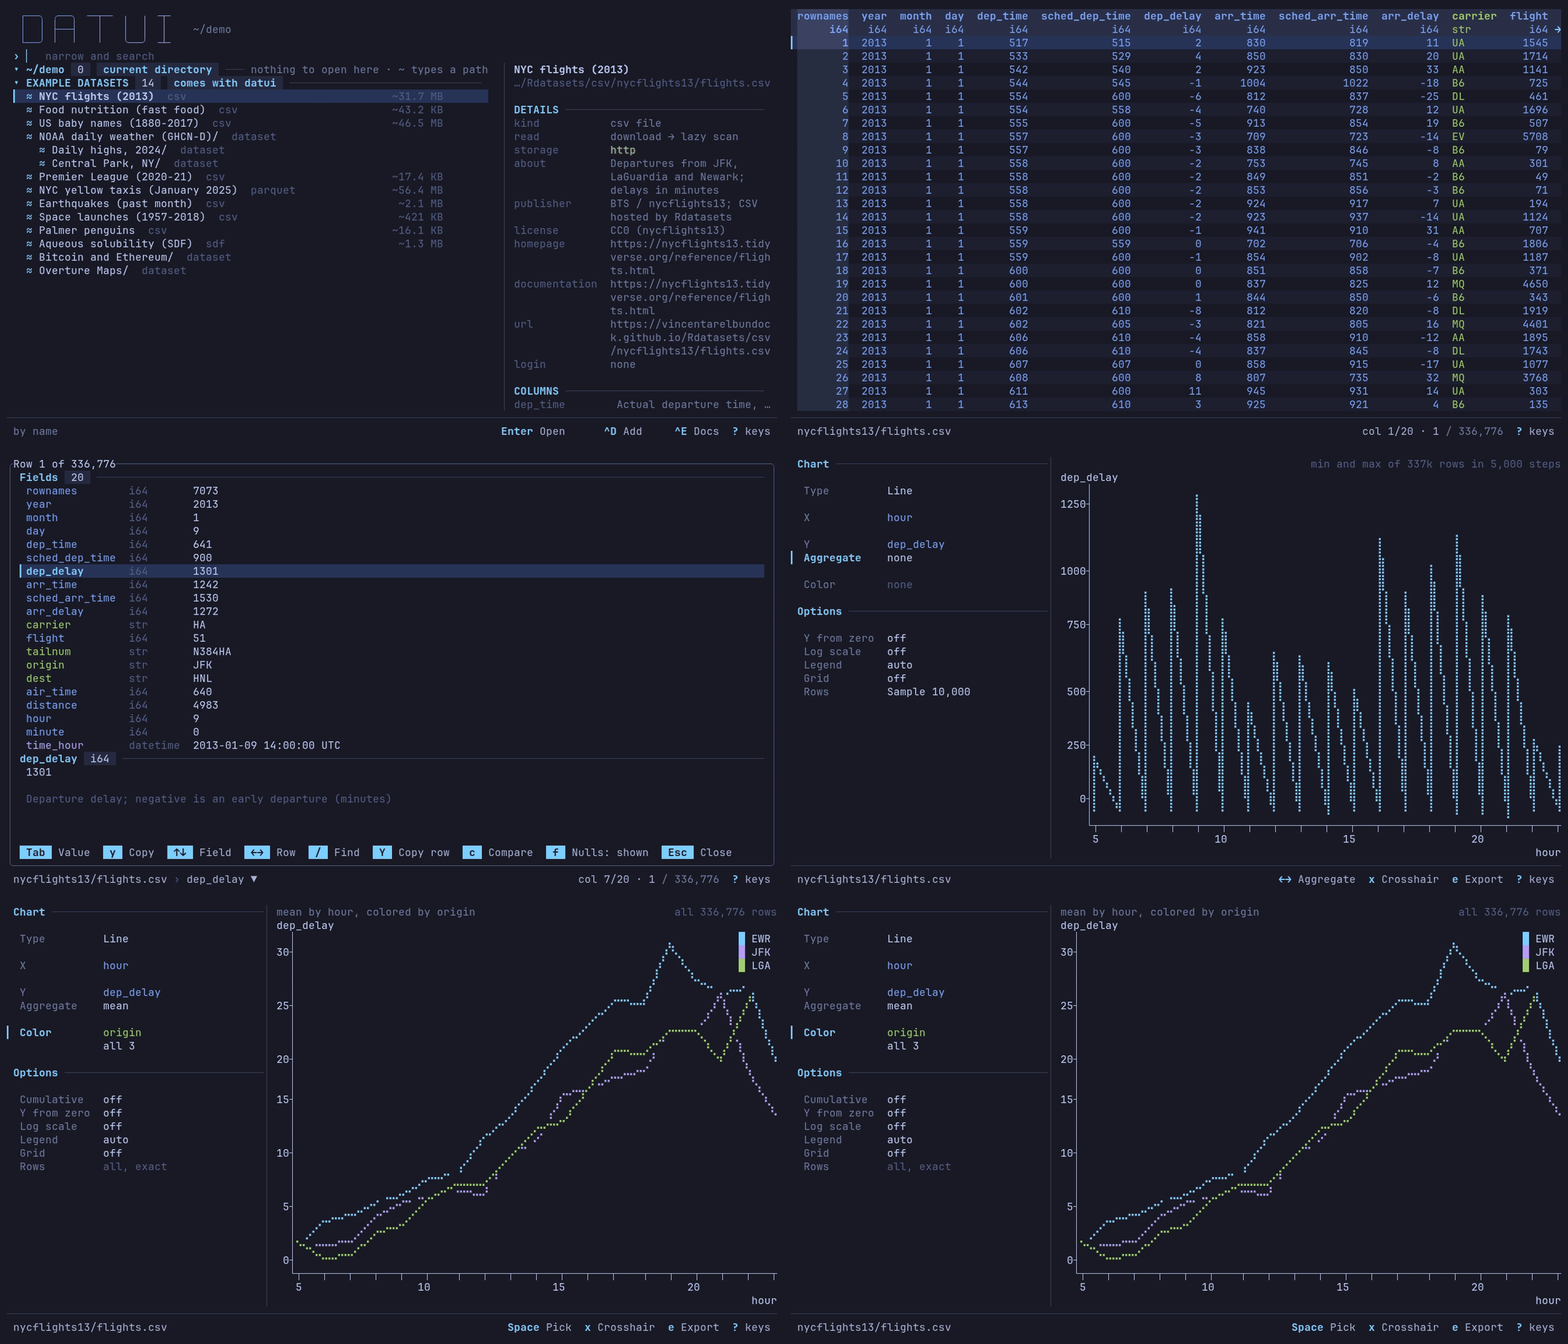
When should I fly out of JFK?
NYC flights (2013): 336,776 departures from New York’s three airports.
Sorted by dep_delay, inspected, then charted as the mean departure delay by
hour, one line per origin. At JFK it climbs from 0.5 minutes at 5:00 to
26.1 at 21:00. The data is 2013’s; this is not a forecast.
Do it yourself: Query data and Make a chart.
A public bucket, opened in place
NOAA daily weather (GHCN-D) on S3, with no login. Central Park’s 155 years
of daily highs, from the catalog’s bookmark, charted by year; then one year of
the whole bucket, s3://noaa-ghcn-pds/parquet/by_year/YEAR=2024/, opened as
one table and scrolled to its last row. The waits are real; nothing is
downloaded whole.
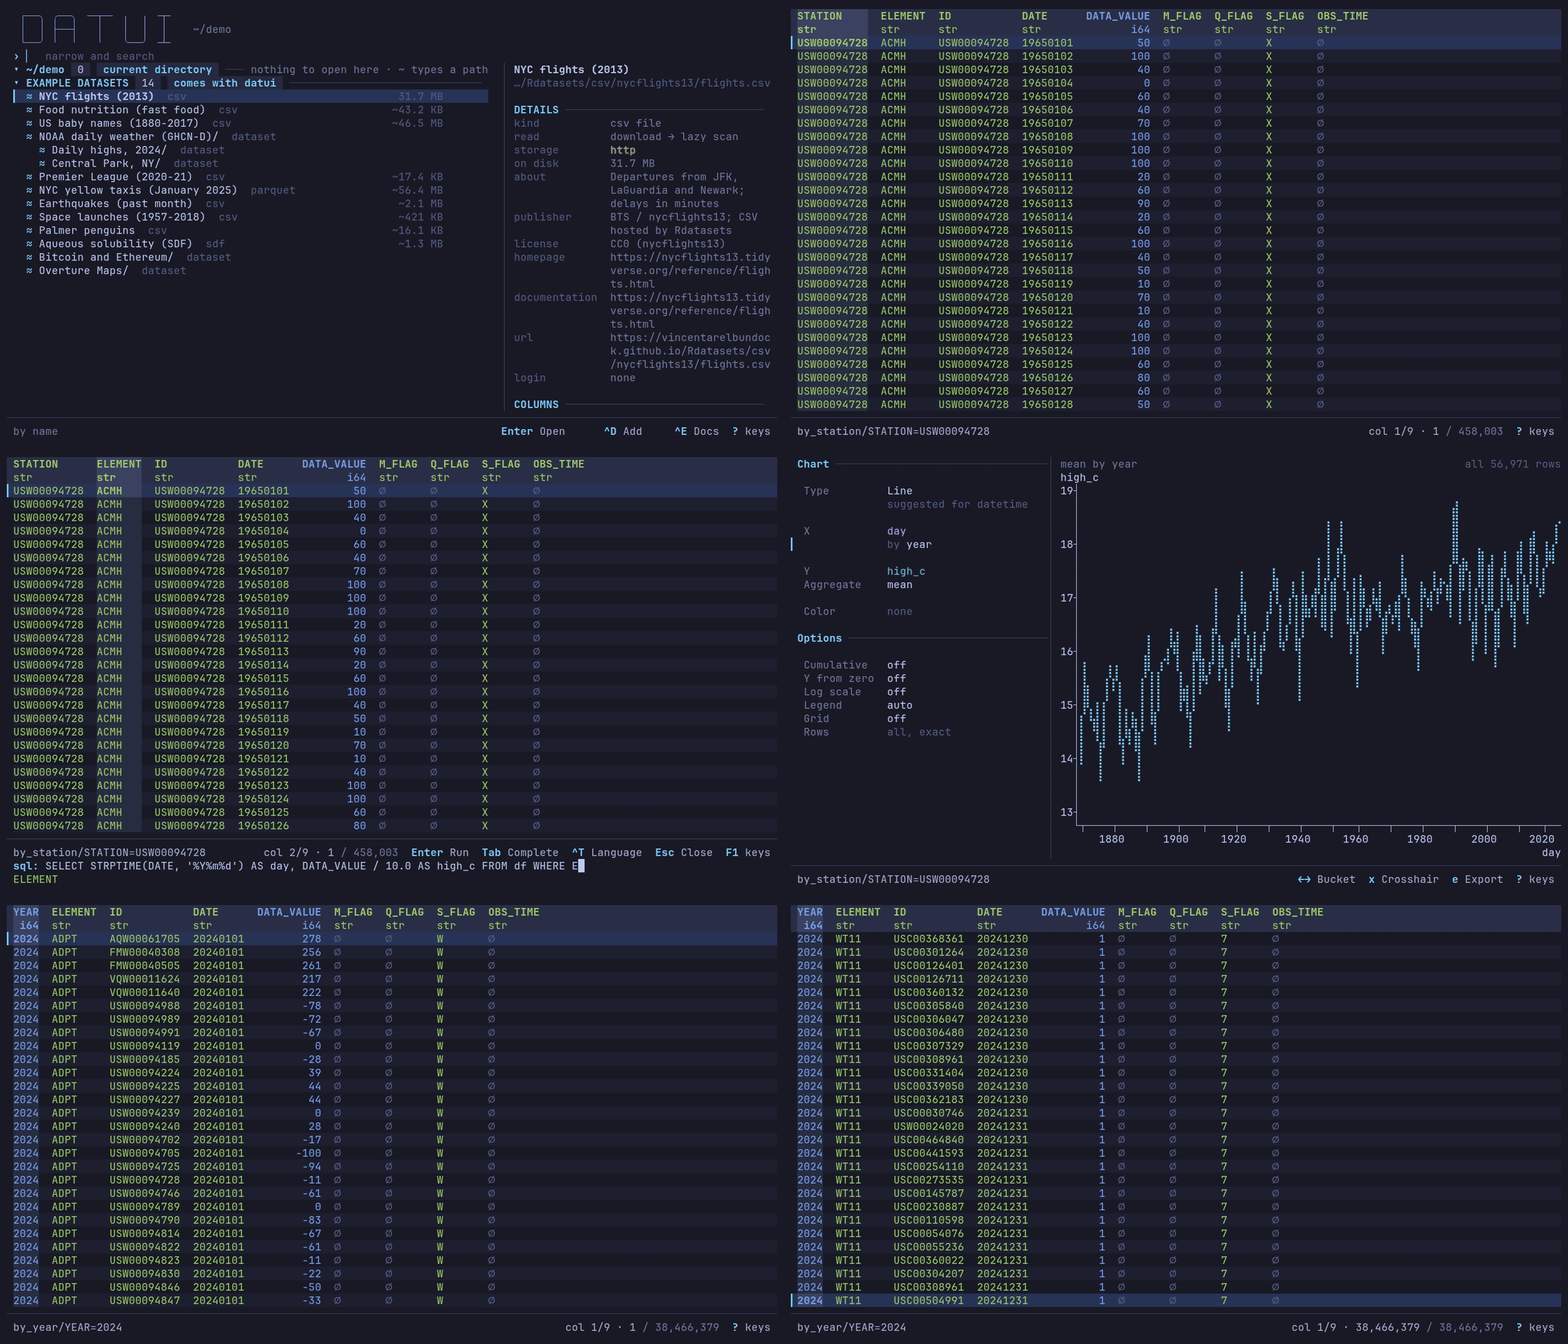
Recorded 2026-10-05 with datui 0.4.0-dev on an 8-core Ryzen 7 9800X3D, over a
wired home connection, with a cold cache: YEAR=2024 opened its 135 files as
one table of 38,466,379 rows in about a second. Your times depend on your
connection and the bucket.
Do it yourself: Connect to cloud storage.
More examples
| Question | Dataset | Guide |
|---|---|---|
| Which species is heaviest? | Palmer penguins | Quick start |
| Which airlines arrive late, and where does AS fly? | NYC flights (2013) | Query data |
| Which matches had the most goals? | Premier League (2020-21) | Dates and messy text |
| The heaviest chicken dishes | Food nutrition (fast food) | Sort, filter and arrange columns |
| Emma, Jennifer and Olivia by year | US baby names (1880-2017) | Pivot and melt |
| Every chart on the built-in data | Several | Make a chart |
| One query, two years of weather | NOAA daily weather (GHCN-D) | Save and apply views |