Introduction
Datui is an interactive terminal user interface (TUI) for exploring and analyzing data files.
Datui is in rapid development—features and interfaces are evolving.
See It In Action
Use arrow keys or vim-style bindings (j/k for up/down, h/l for left/right) to explore interactively.

For more demonstrations of Datui’s features, see the Demos page.
Getting Started
To get started with Datui, see the Getting Started guide.
Demo Gallery
This page showcases interactive demonstrations of Datui’s features.
Overview
Home Screen

What it shows:
- Running
datuiwith no arguments - Recents, the current directory, and directories of datasets opened before
- The details pane: source filesystem, rows, columns, size on disk, size once decompressed with its codec and ratio, row groups, and hive partition layout
- Typing to filter, with the matched characters underlined
Found, the recursive search of the working directory that typing starts- Matching on a column (
ticfinds every dataset with atickercolumn) - Opening a dataset with
Enter
See The Home Screen for the full guide.
Navigation
What it shows:
- Loading a Parquet file (
people.parquet) - Scrolling through data using
↑/↓(orj/k) keys
See Loading Data for more information about file formats and options.
Querying
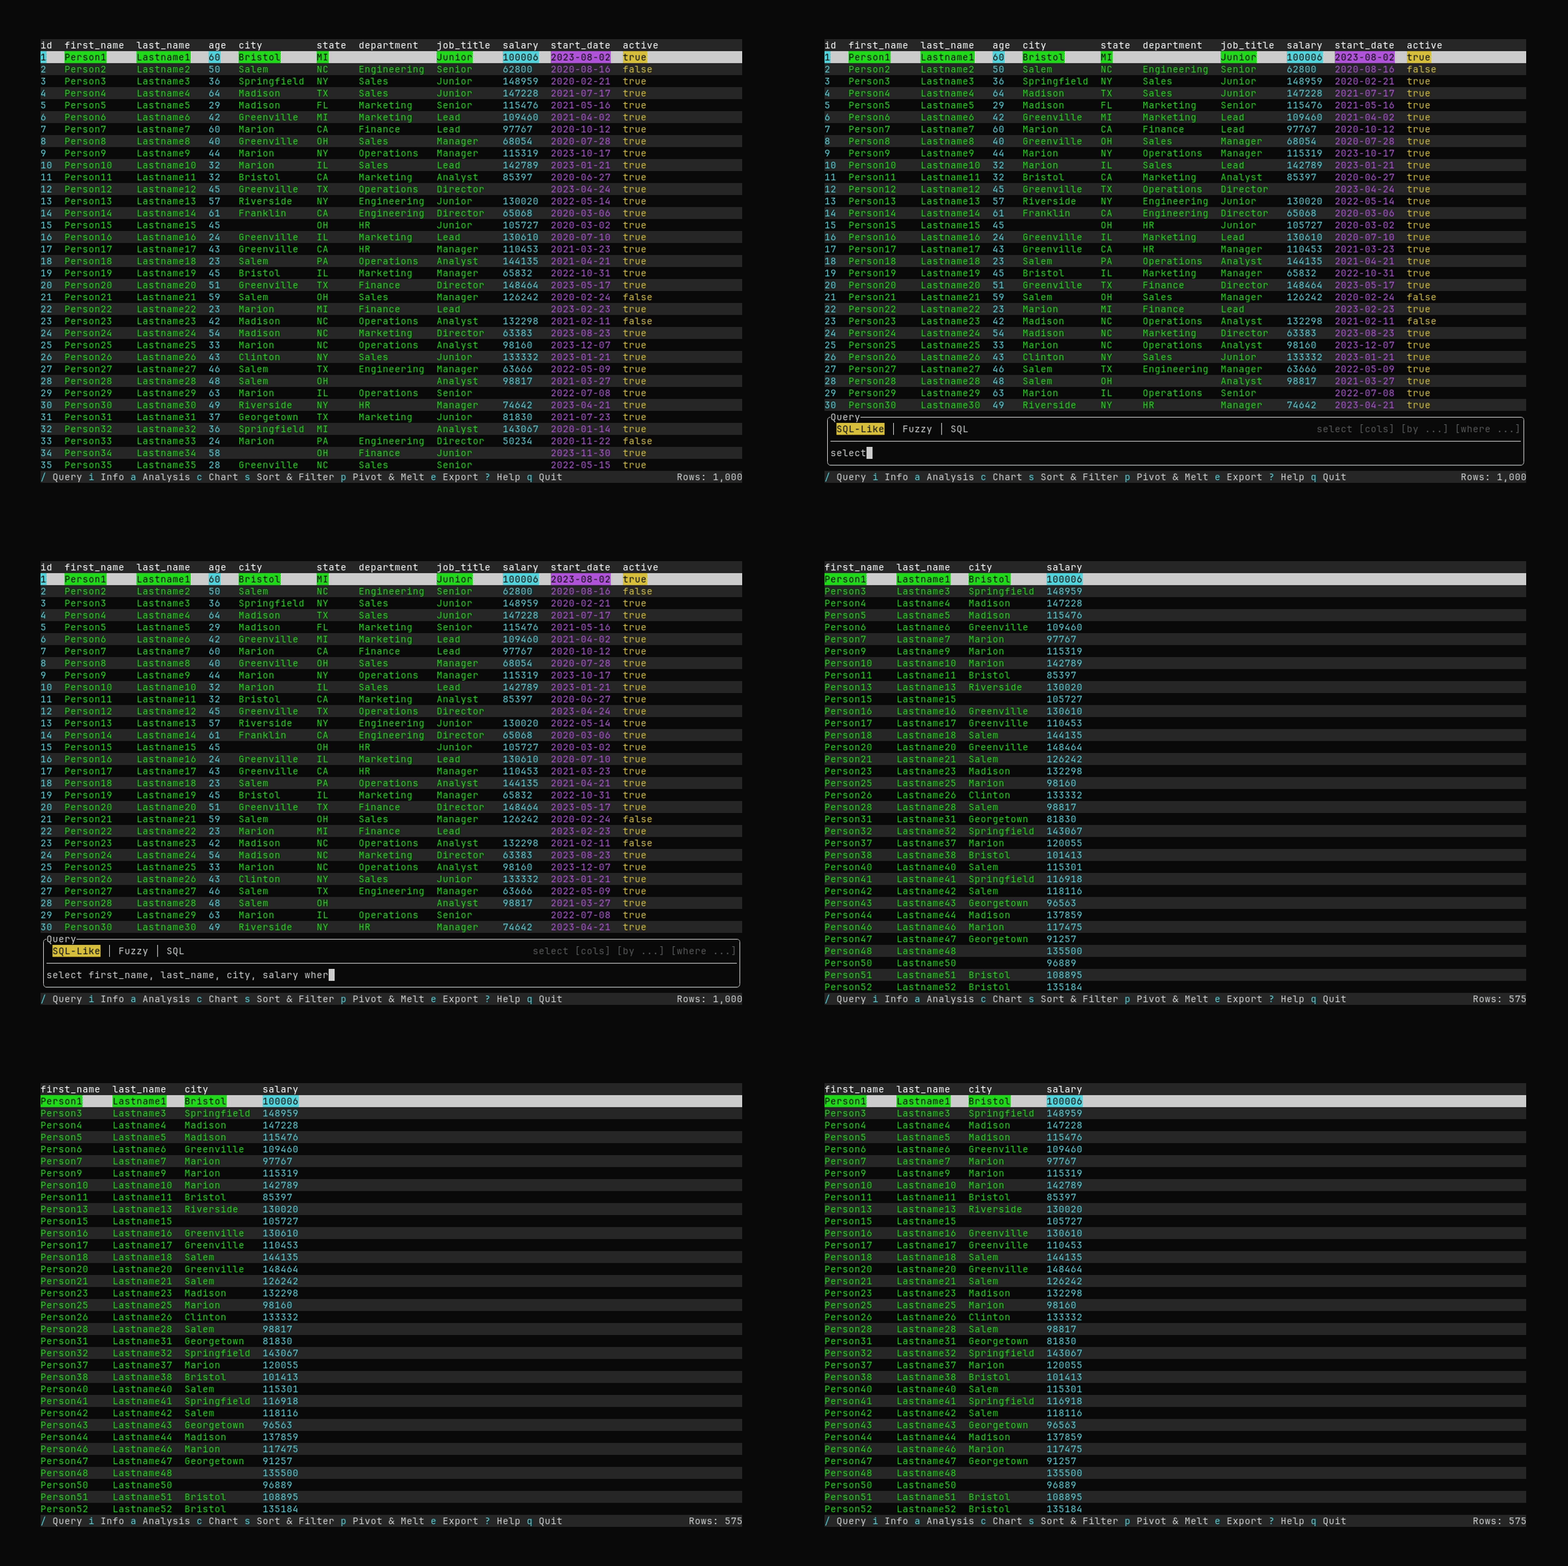
What it shows:
- Opening the query input with
/ - Typing a query:
select first_name, last_name, city, salary where salary > 80000 - Executing the query and seeing filtered results
See Querying Data for detailed query syntax and examples.
Info Panel
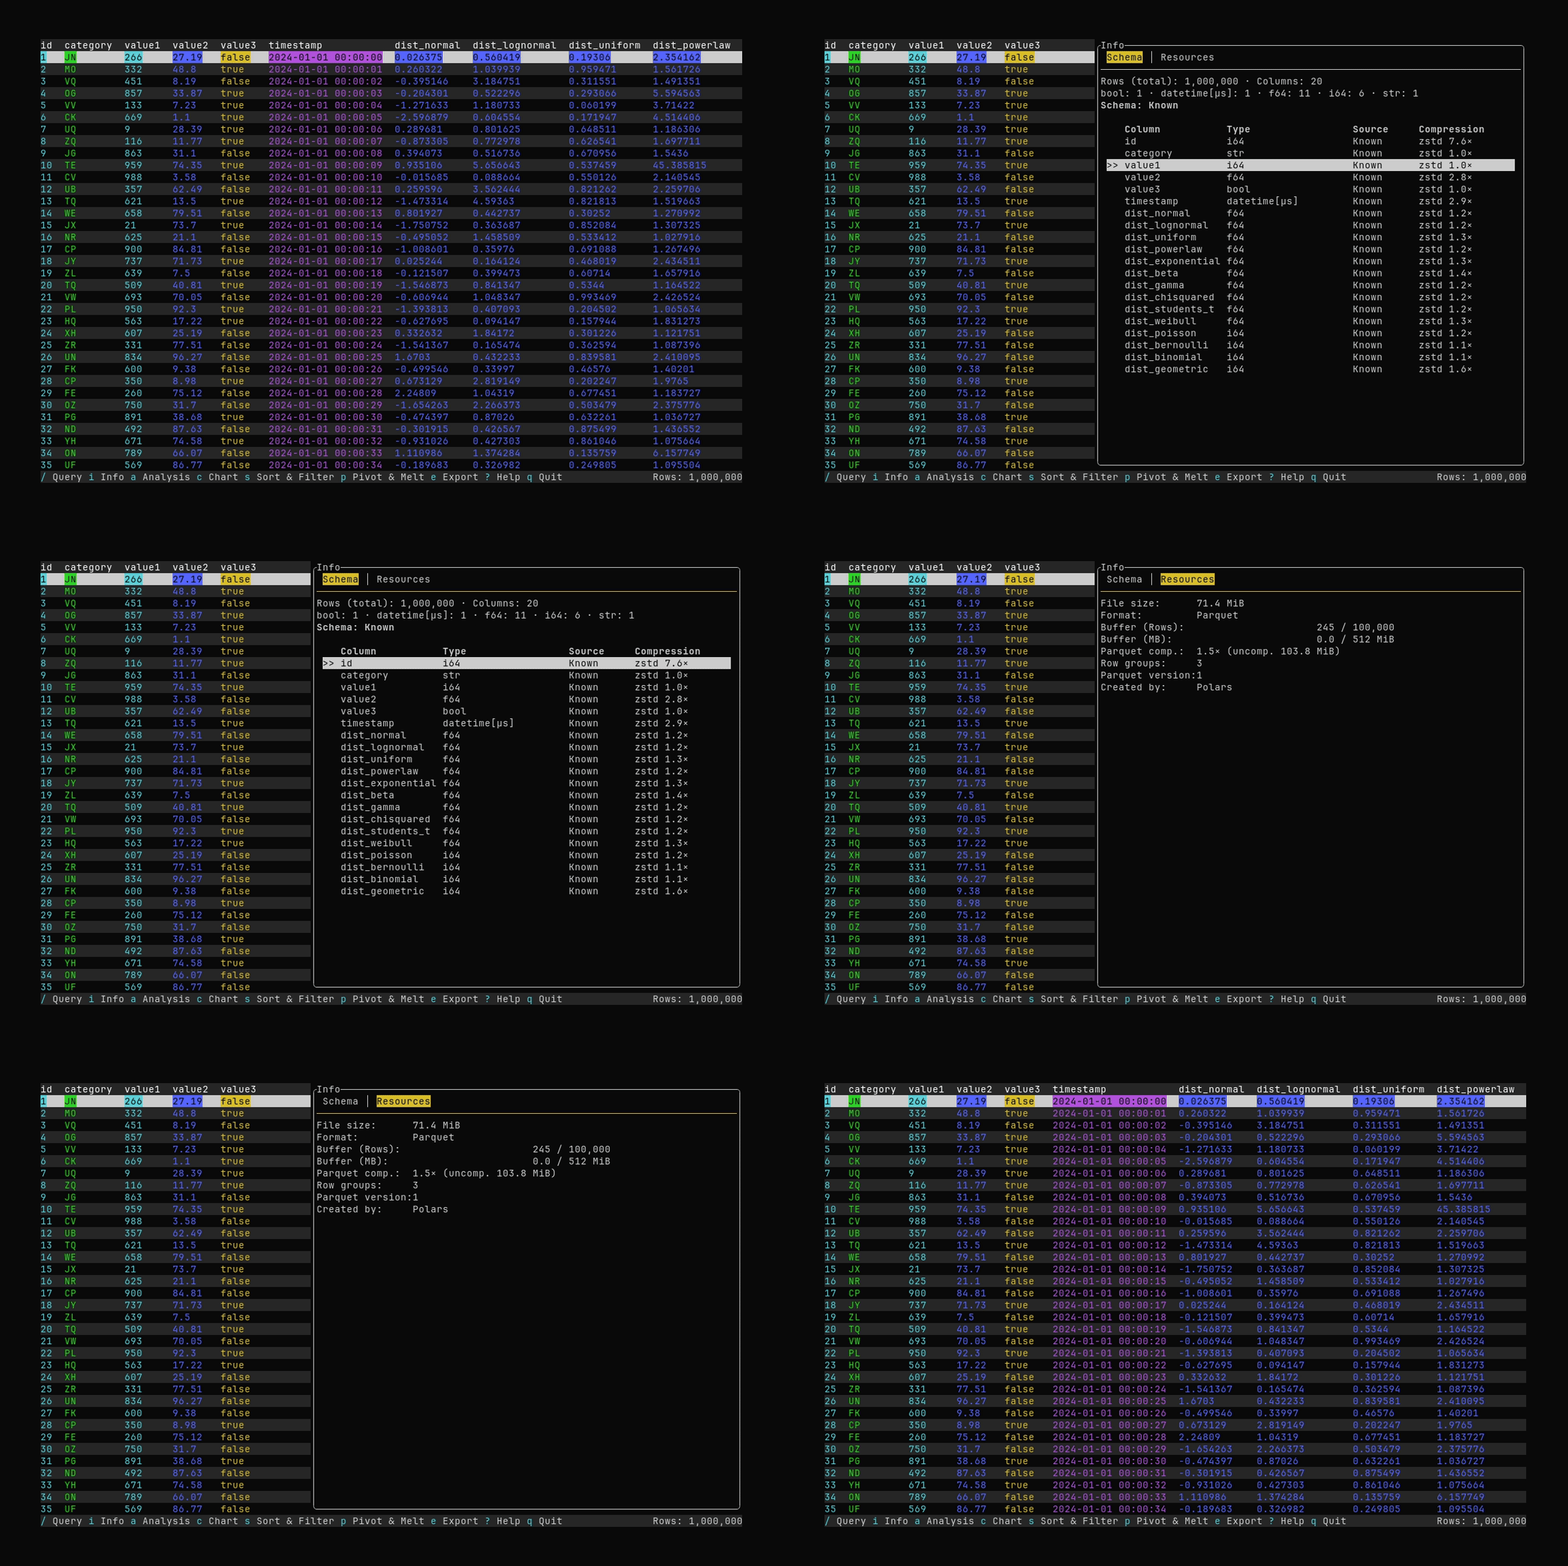
What it shows:
- Opening the Info panel with
i - Viewing information about the dataset
See Dataset Info for details about the Schema and Resources tabs.
Pivot
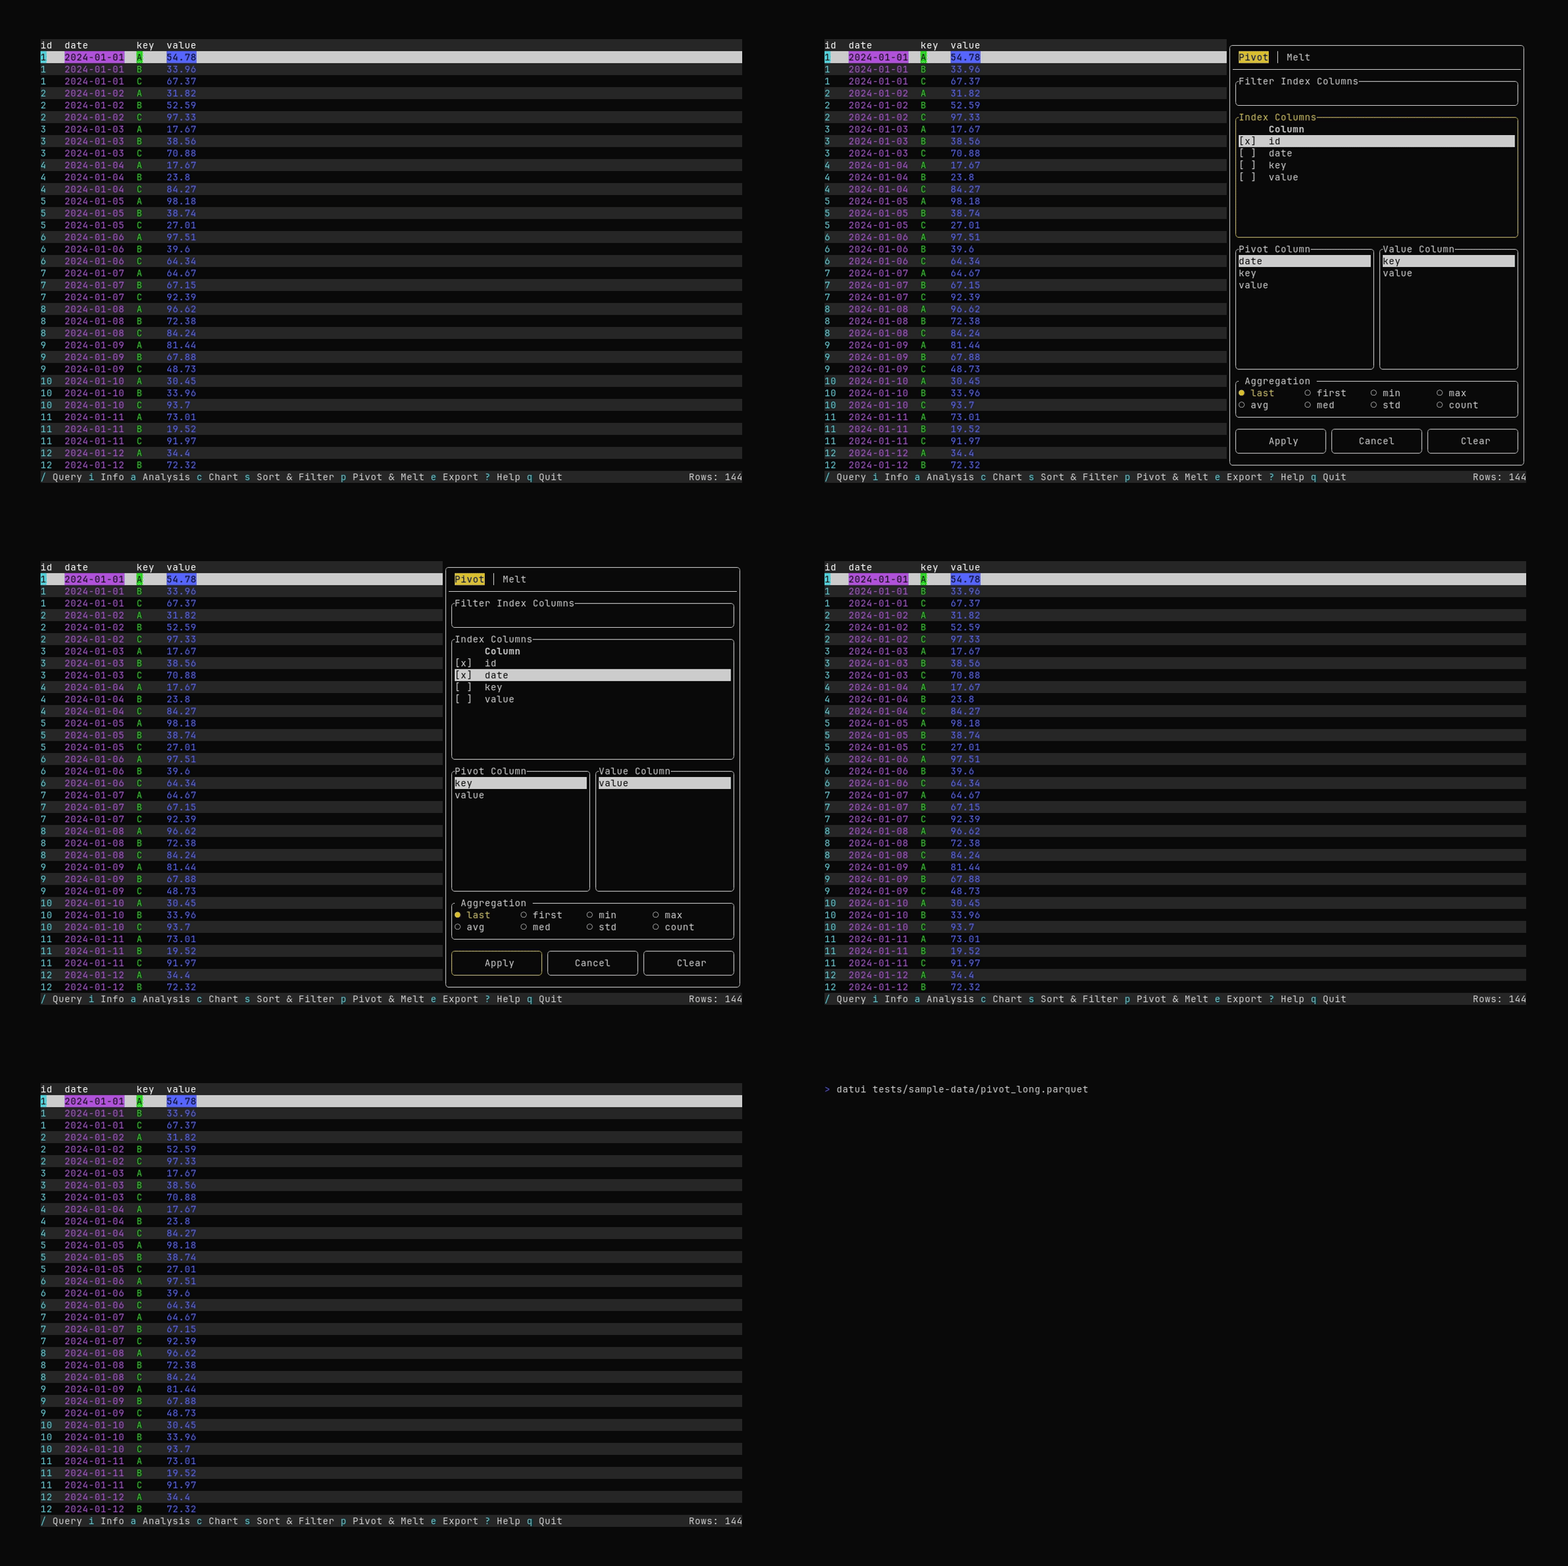
What it shows:
- Opening the Pivot & Melt dialog with
p - Selecting index columns and applying a pivot (long → wide)
See Pivot and Melt for pivot and melt options.
Melt
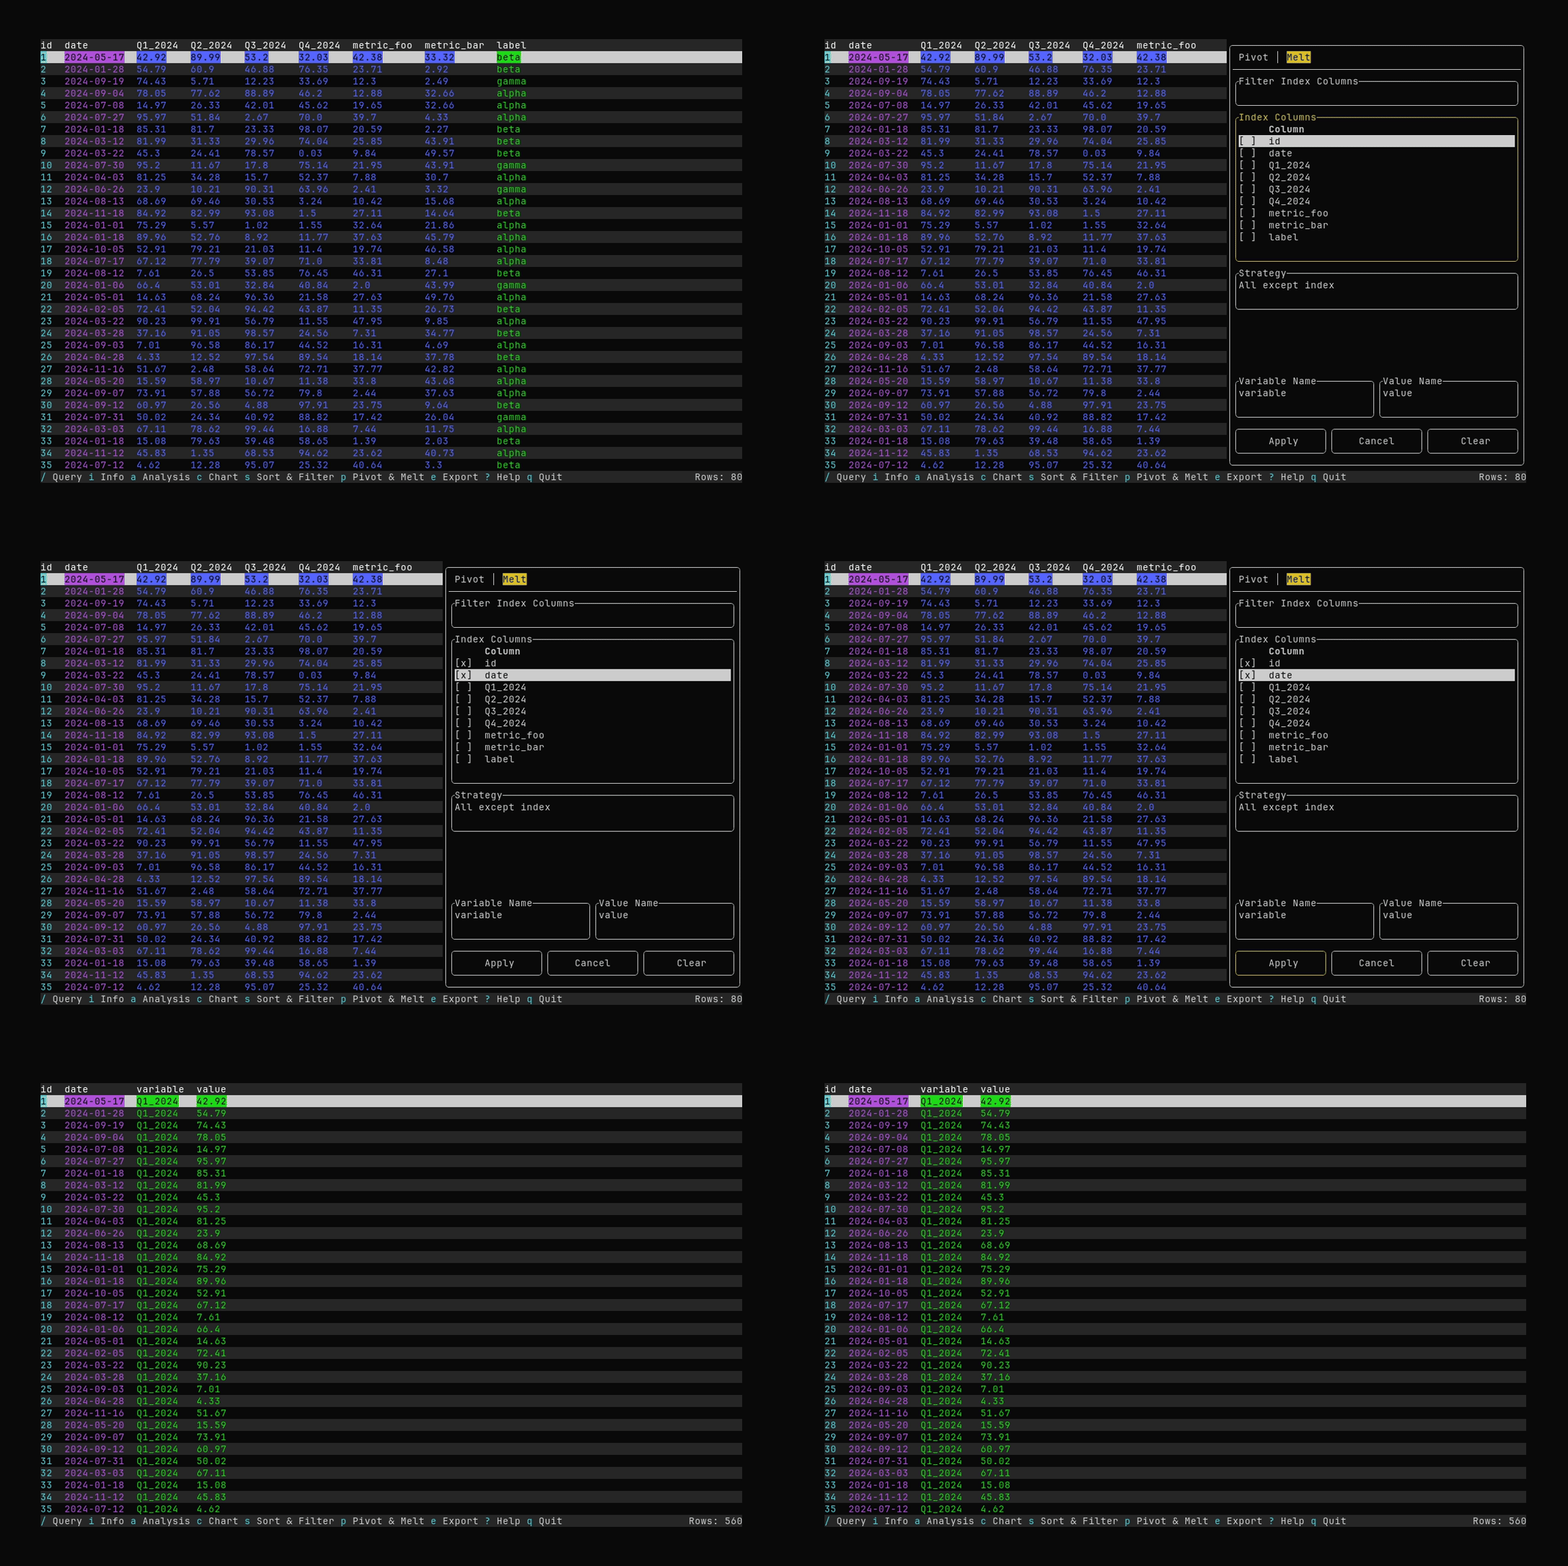
What it shows:
- Switching to the Melt tab and selecting index columns
- Applying a melt (wide → long)
See Pivot and Melt for pivot and melt options.
Sorting
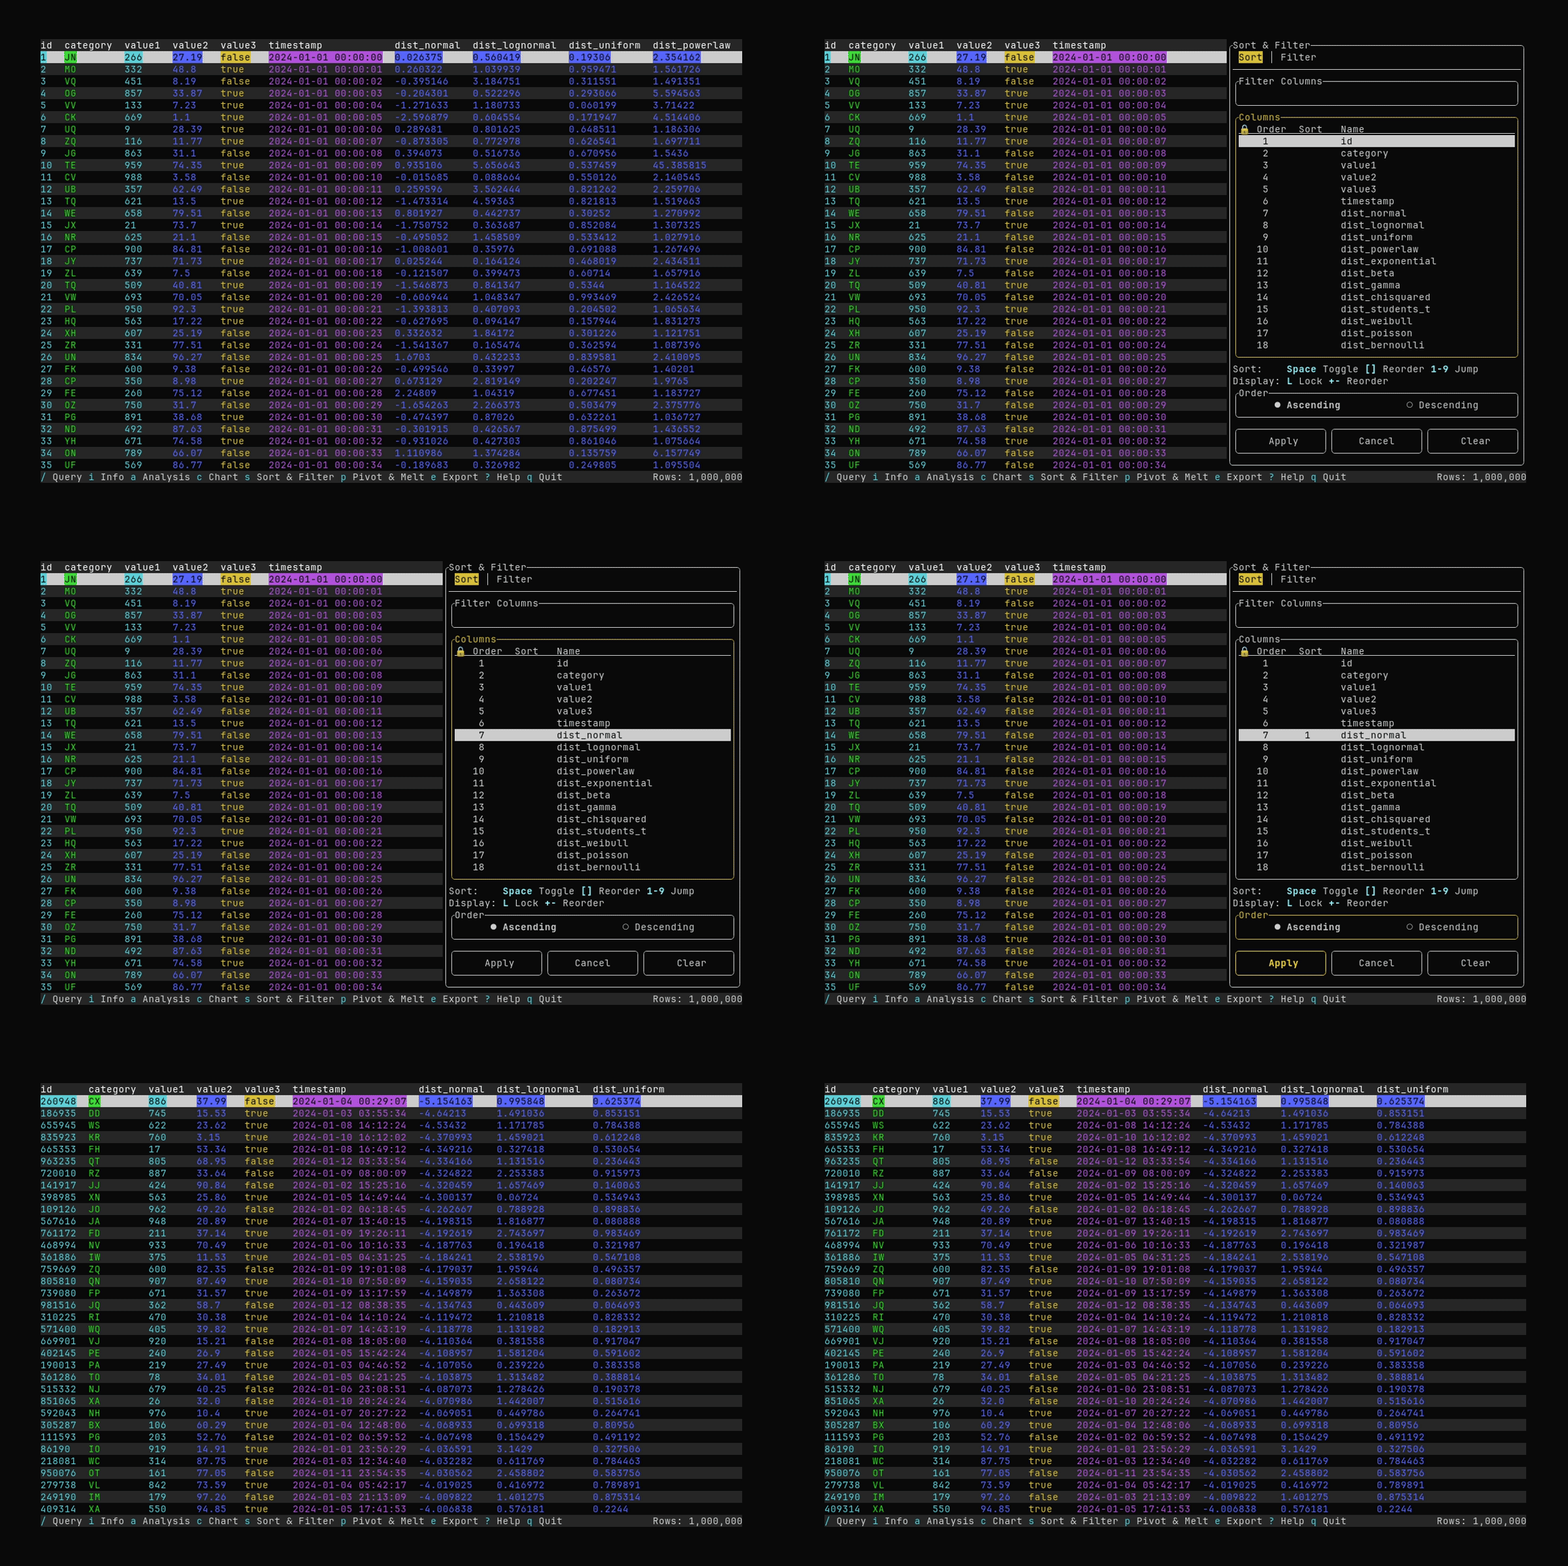
What it shows:
- Opening the Sort & Filter dialog with
s - Selecting a sort column and applying the sort
See Filtering and Sorting for sort and filter options.
Filtering
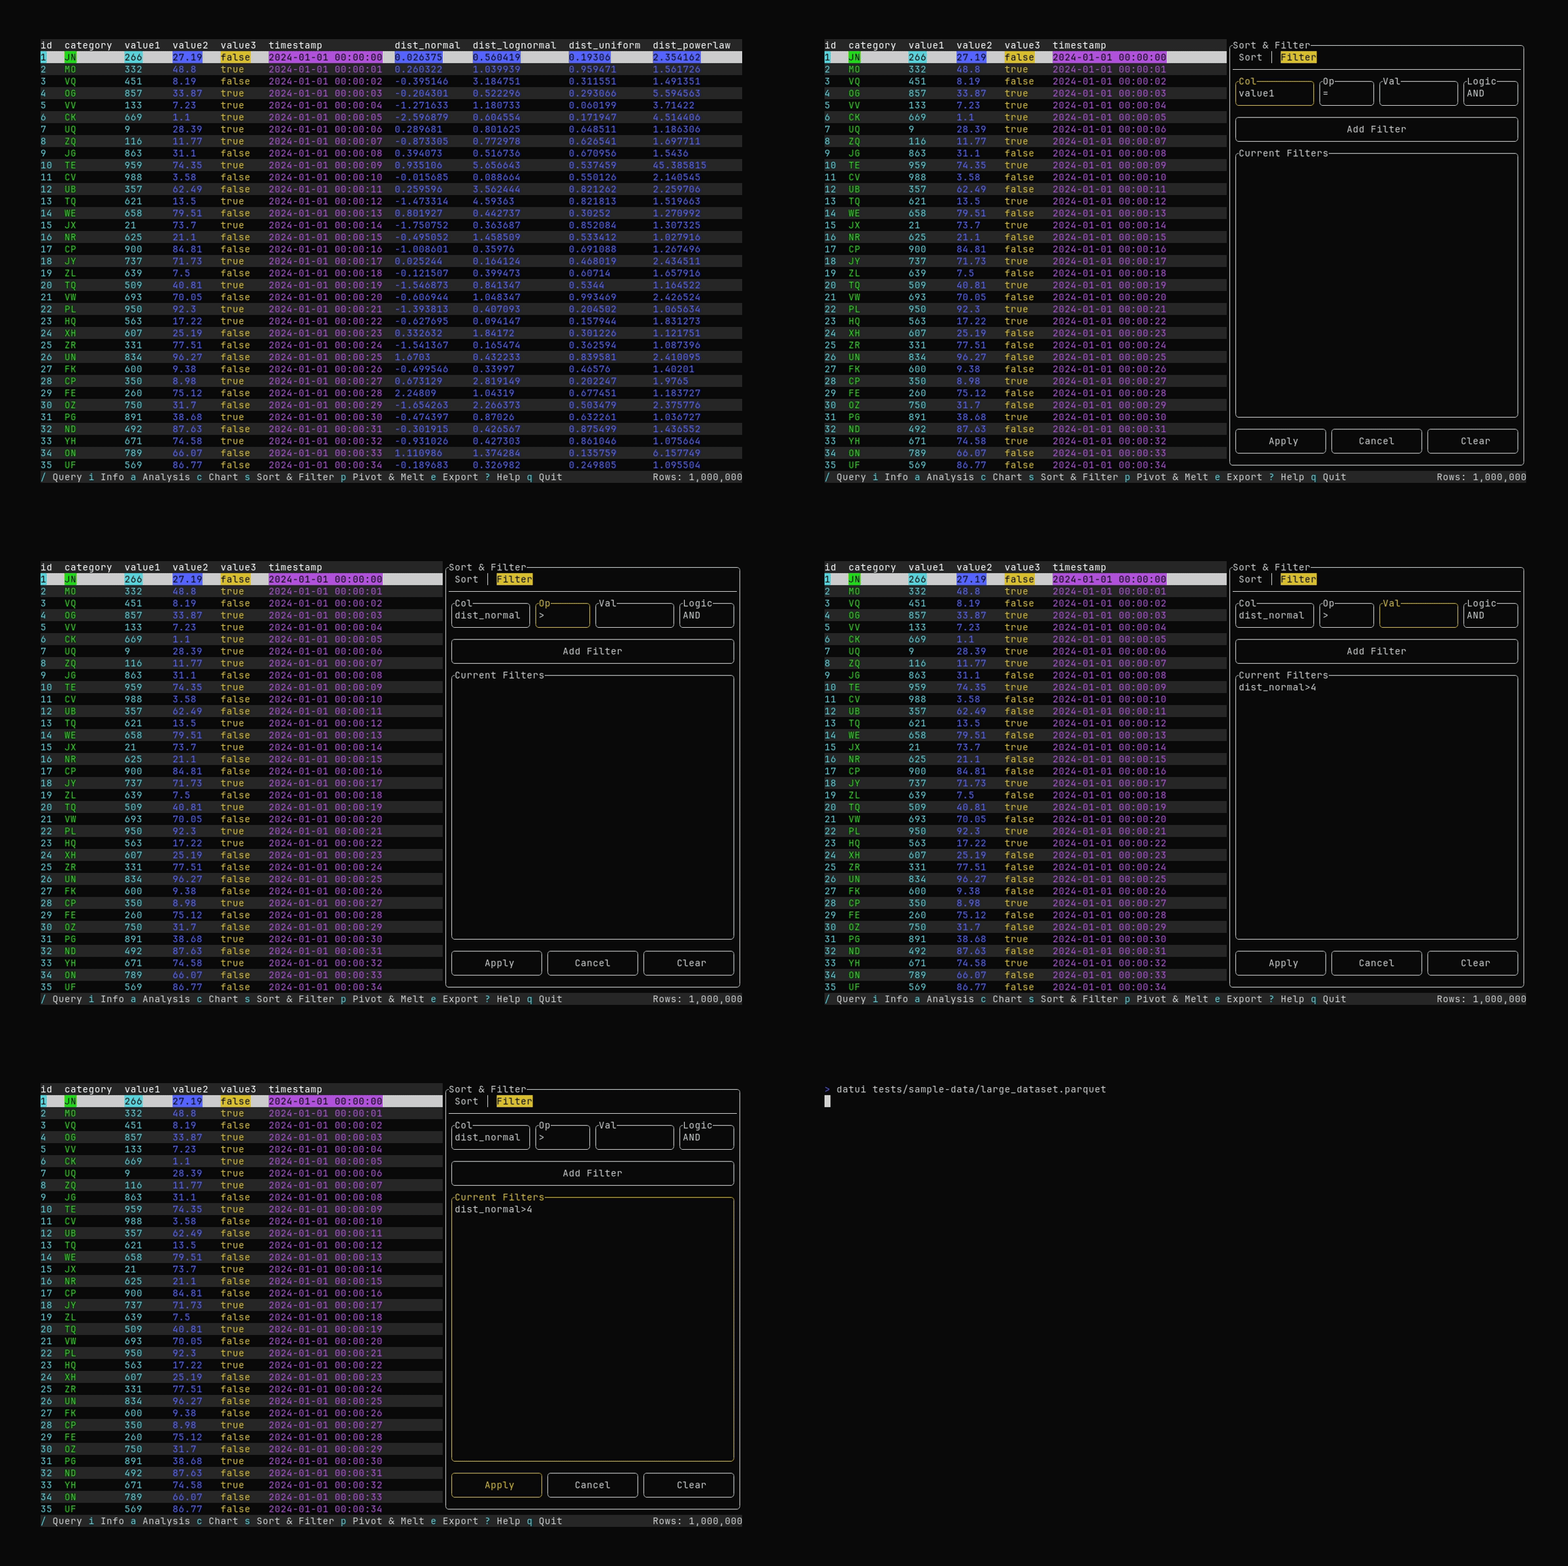
What it shows:
- Switching to the Filter tab and adding a filter (e.g.
dist_normal > 4) - Applying the filter to the table
See Filtering and Sorting for sort and filter options.
Export
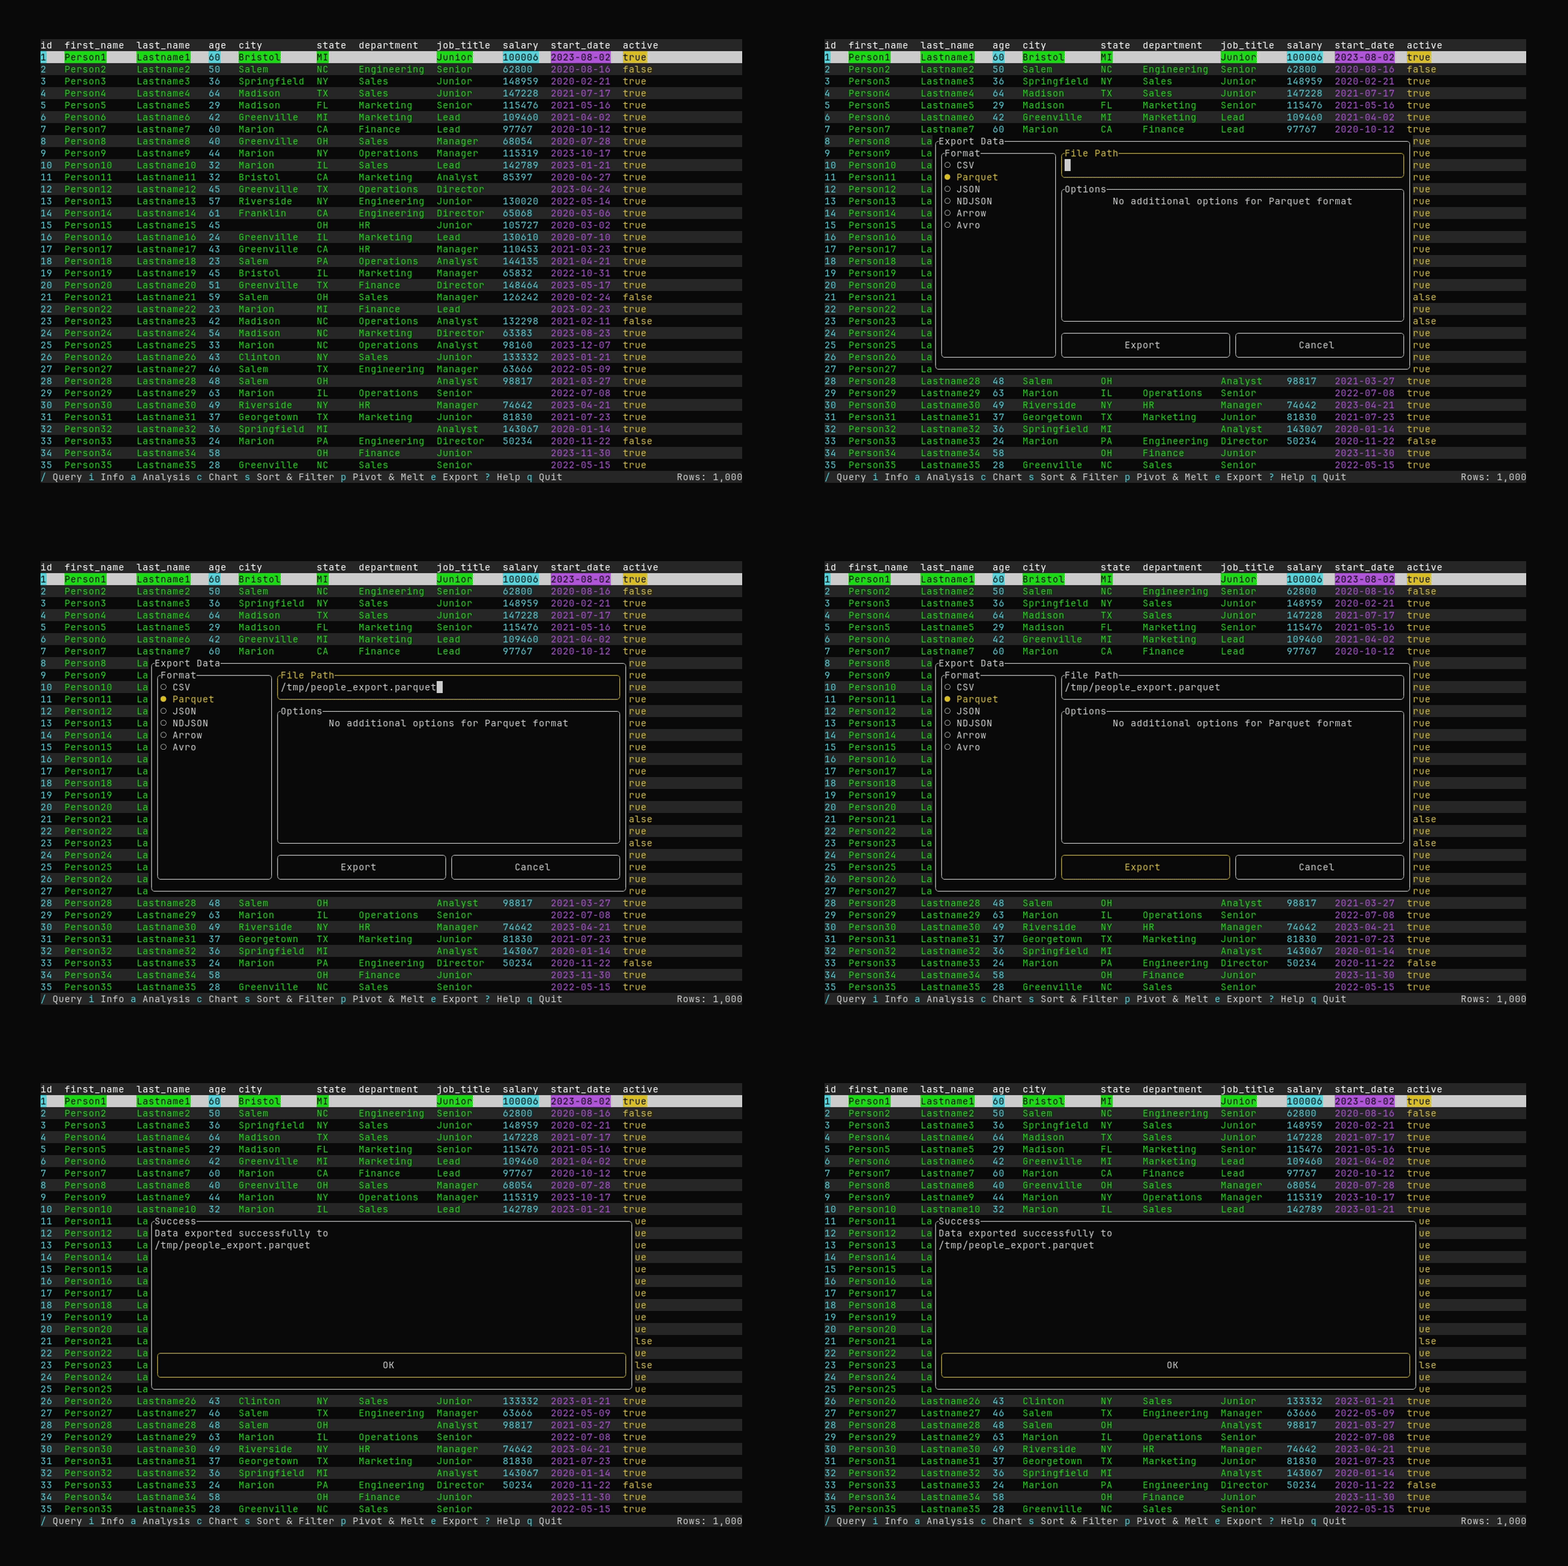
What it shows:
- Opening export with
eand entering an output path - Exporting the current data to Parquet in
/tmp
See Exporting Data for supported formats and options.
Correlation Matrix
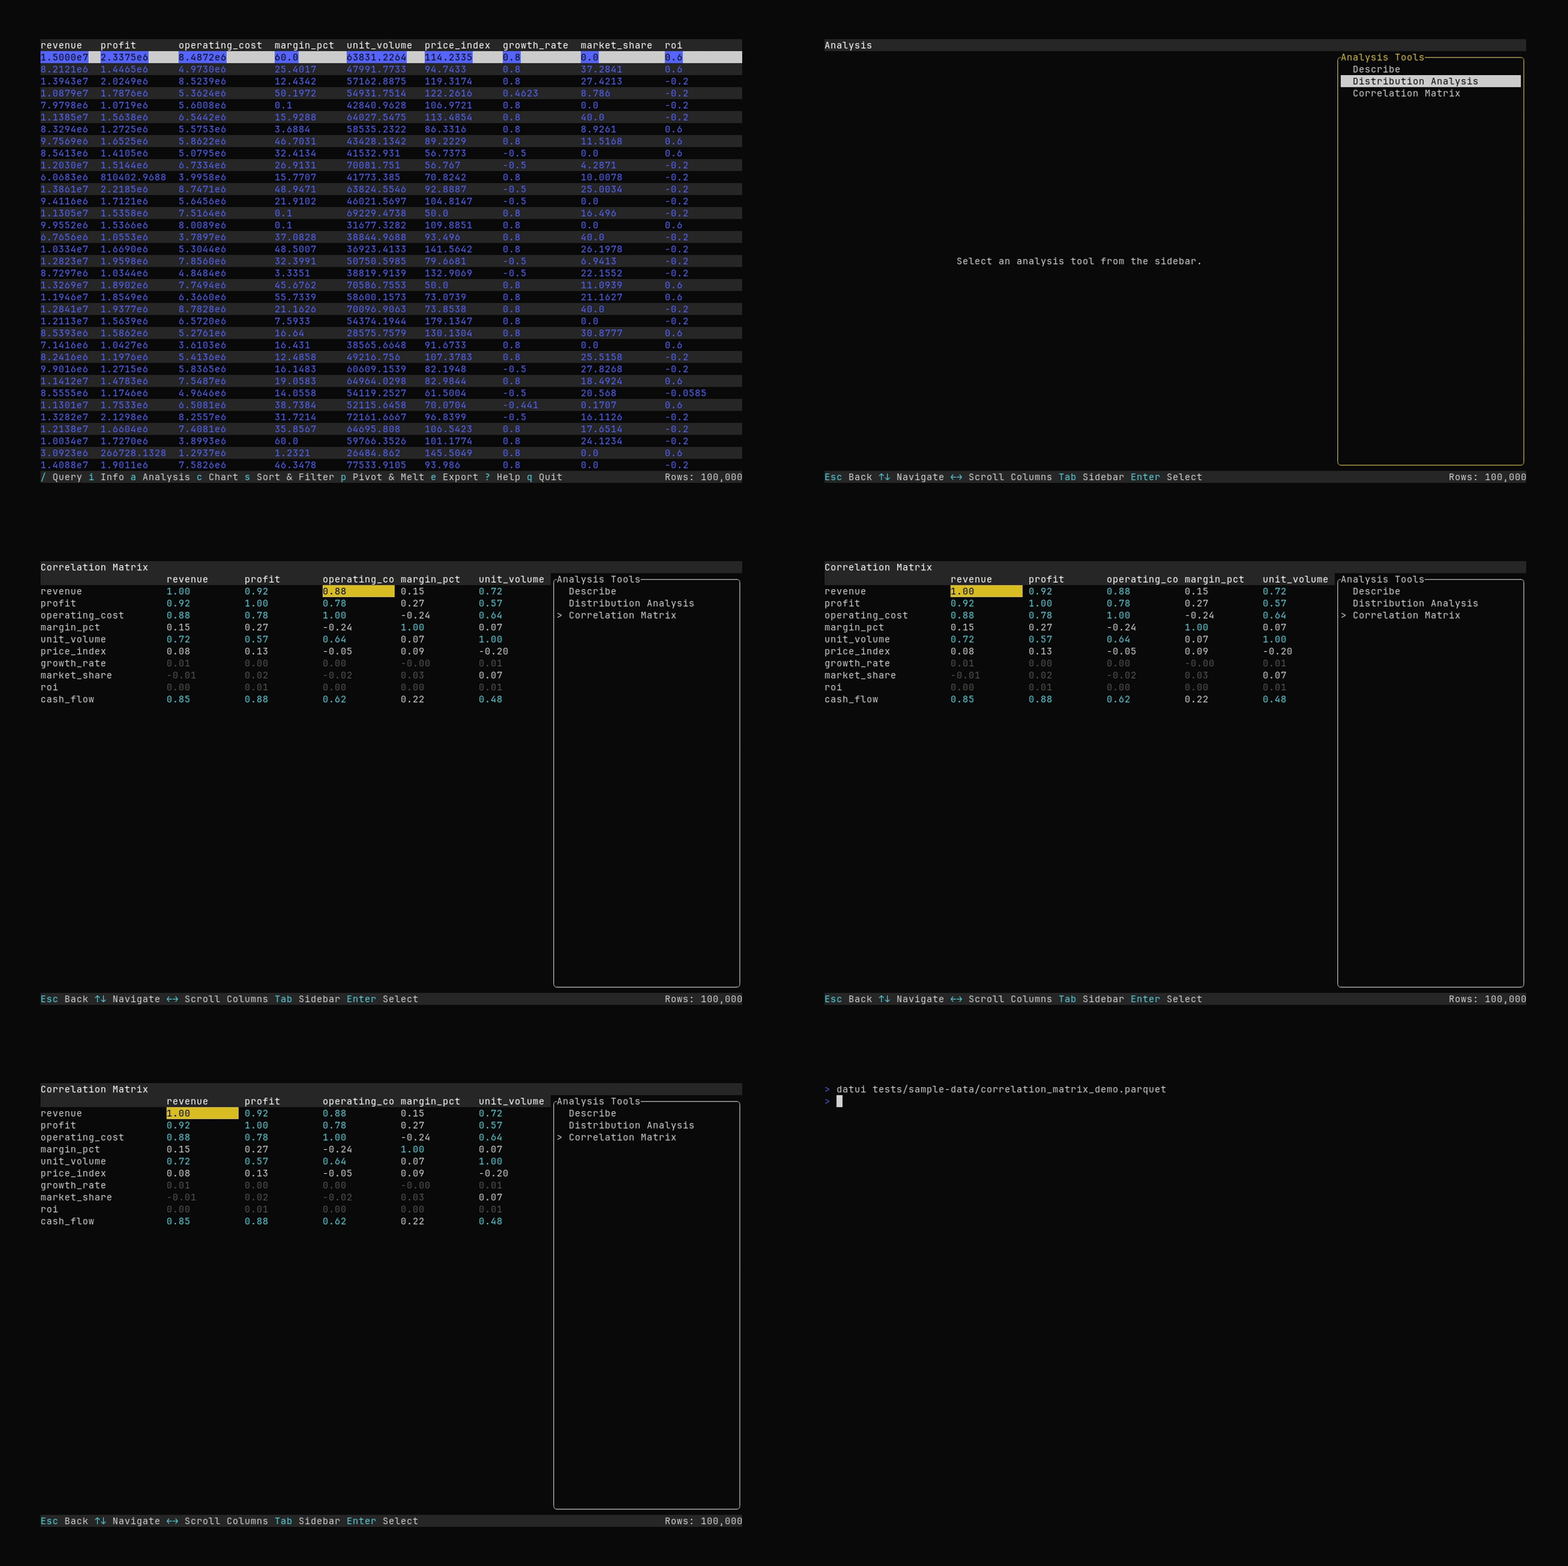
What it shows:
- Opening analysis with
aand selecting the Correlation Matrix tool - Scrolling the correlation matrix
See Analysis Features for details.
Charting
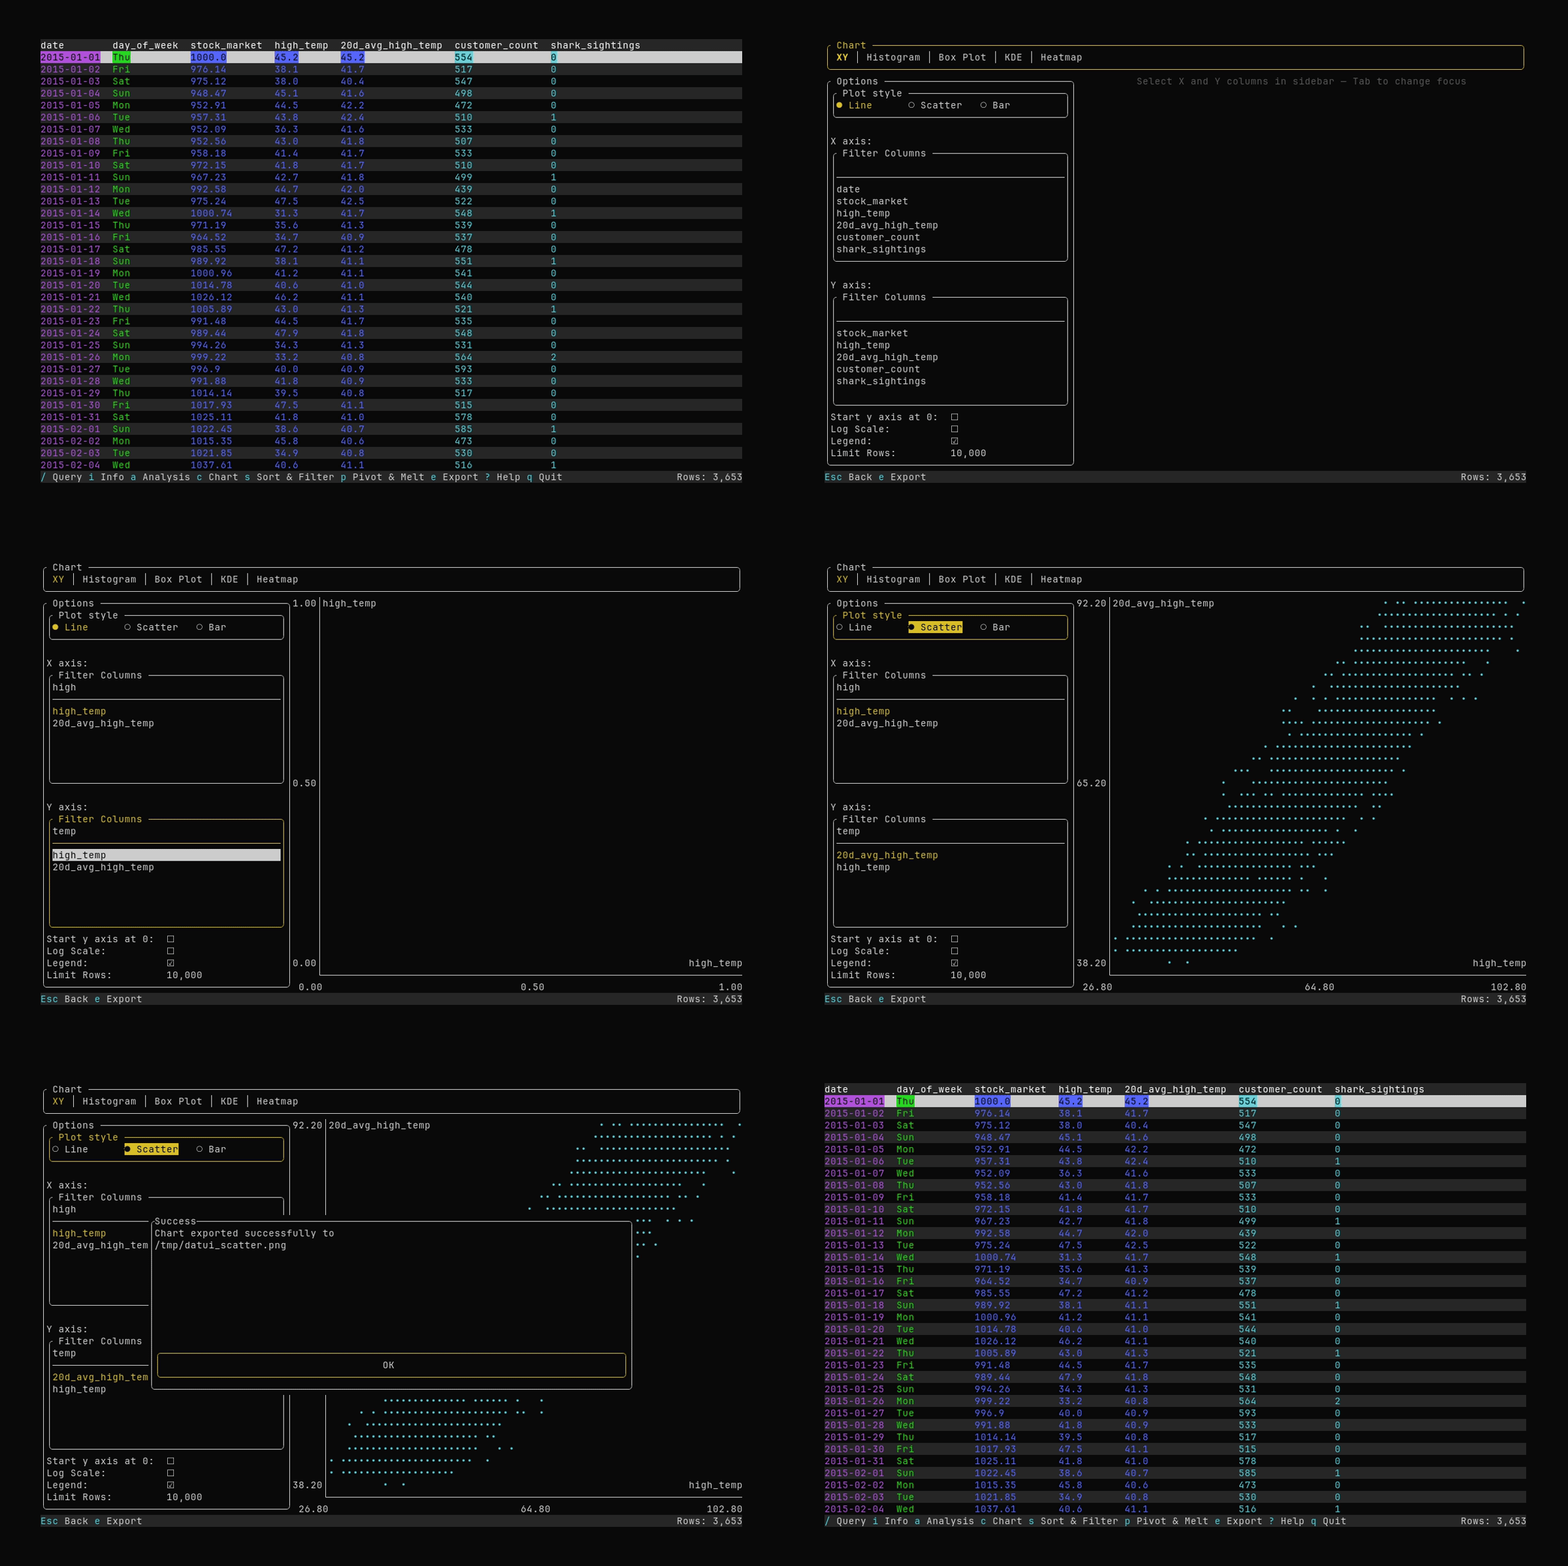
What it shows:
- Opening the chart with
c - Viewing data in a line chart, and then a scatter plot
- Exporting the chart to a PNG file
See Charting for more details.
Overview
What it shows:
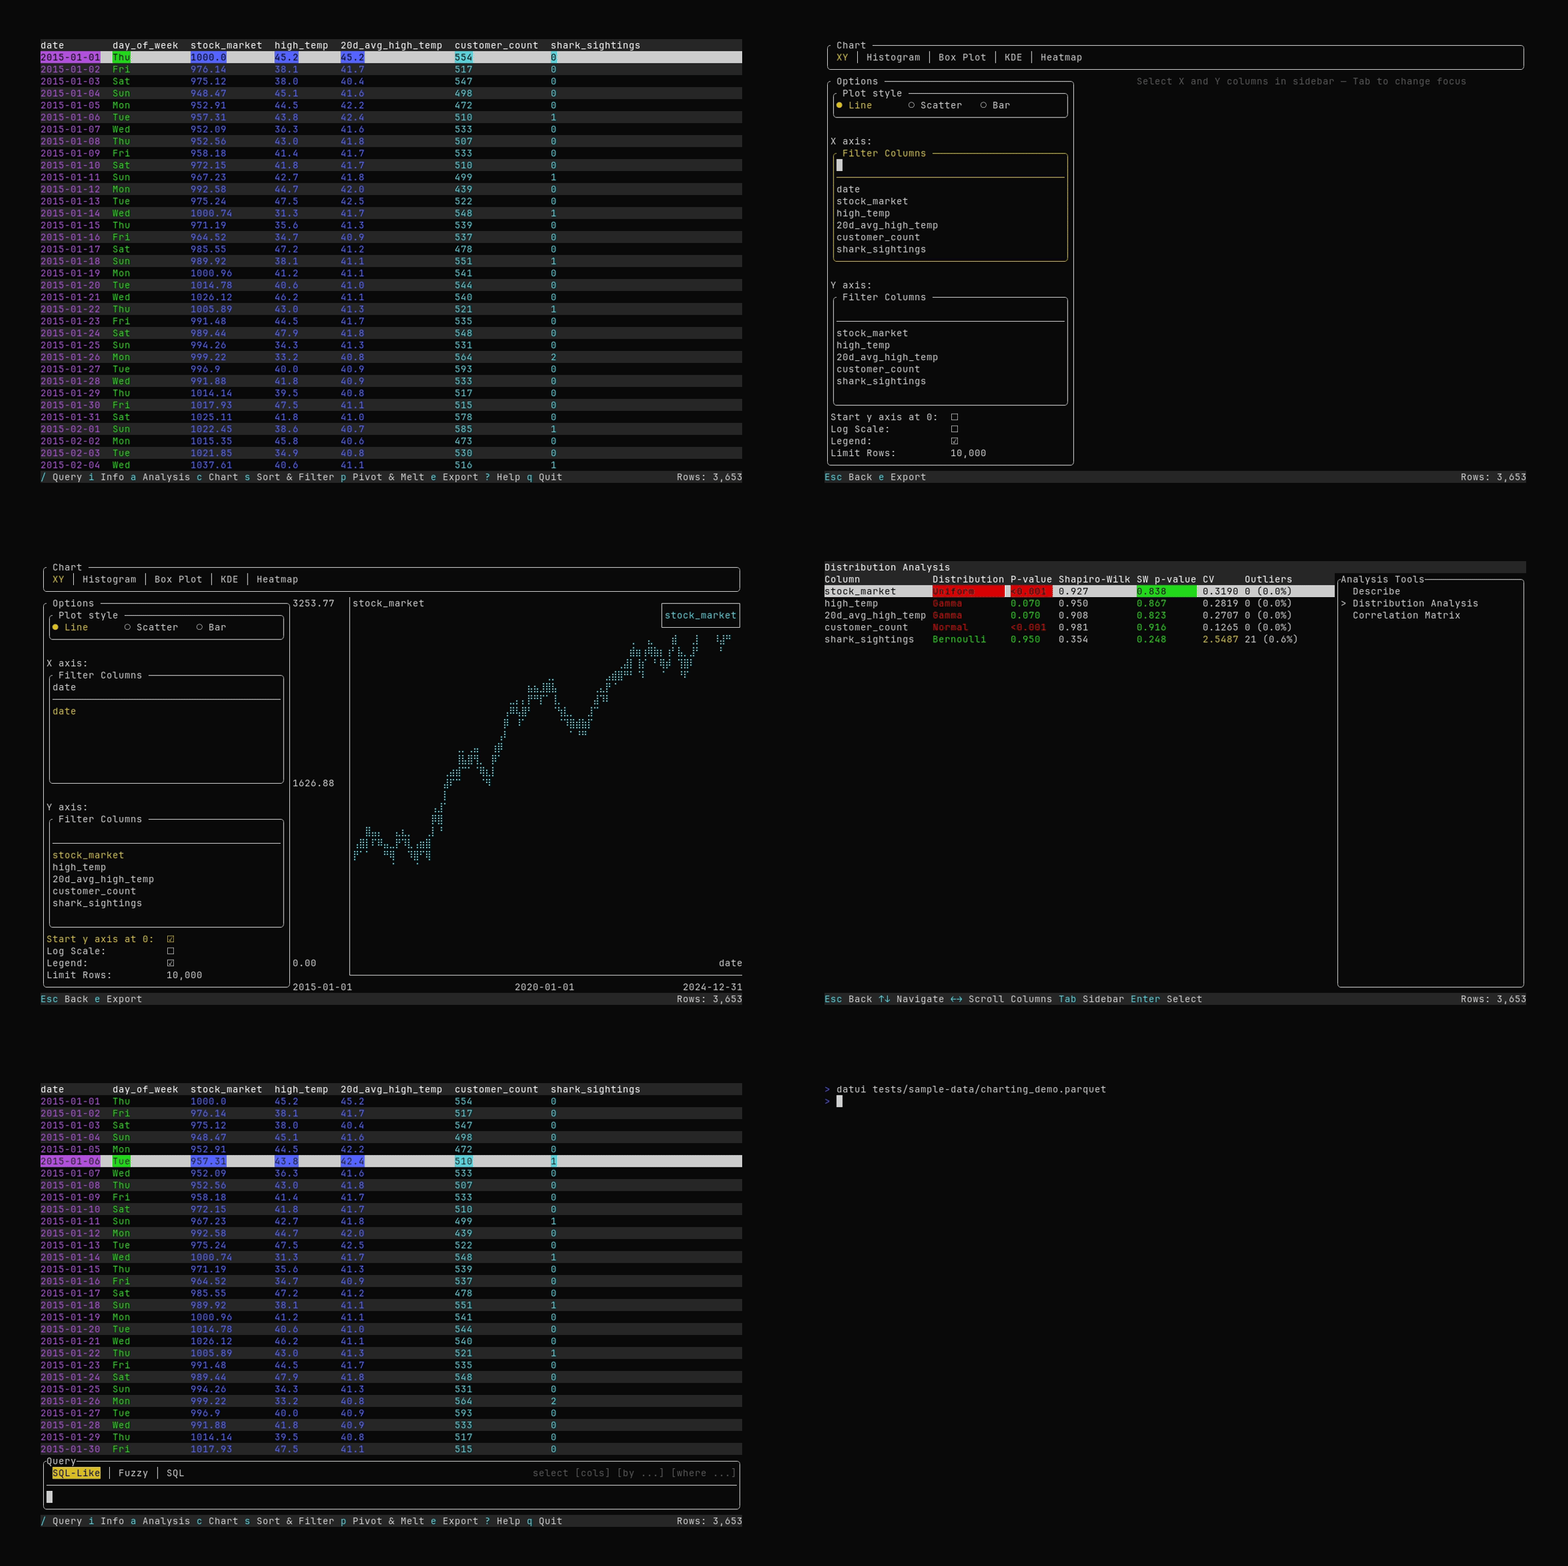
- Scrolling up and down on a Parquet file (
charting_demo.parquet) - Opening the chart and plotting the stock_market series with date on the x-axis
- Opening the Analysis page and the Describe tool (column statistics)
- Returning to the main table and running a query (
select date, stock_market, high_temp where stock_market > 1200)
A single ~30–45 second tour of table navigation, charting, analysis, and querying.
To install and run Datui, see the Getting Started Guide.
Getting Started
- See the Installation Manual
- Read the Quick Start Guide to get started
For Developers
See the For Developers section.
Installation
Once installed, have a look at the Quick Start Guide.
✨ Quick Install for Linux and macOS
curl -fsSL https://raw.githubusercontent.com/derekwisong/datui/main/scripts/install/install.sh | sh
Don’t like piping to shell? See the alternative methods below.
Releases
Download a ready-to-use copy from the Latest Release on GitHub.
Datui runs on Linux, macOS, and Windows
Package Managers
Homebrew (macOS)
Install via the derekwisong/datui tap:
brew tap derekwisong/datui
brew trust derekwisong/datui
brew install datui
Homebrew requires brew trust before it will install from a third-party tap.
Windows (WinGet)
Install via WinGet: The Windows Package Manager:
winget install derekwisong.datui
Arch Linux (AUR)
Datui is available in the Arch User Repository
as datui-bin. Install it with an AUR helper such as
paru or yay:
paru -S datui-bin
or
yay -S datui-bin
Pip
Get the module from PyPI and launch Datui right from a Python console.
pip install datui
See Python Module.
RPM-based (Fedora, RedHat)
Get the link to the .rpm file for the release version you want from the Latest Release.
Use dnf to install that link.
dnf install https://github.com/derekwisong/datui/releases/download/vX.Y.Z/datui-X.Y.Z-1.x86_64.rpm
Deb-based (Debian, Ubuntu)
Install from the Datui Apt Repository
Installing through the repository makes updating easy and automatic.
-
Install the GPG signing key and the Datui apt source. You only need to do this once.
curl -fsSL https://derekwisong.github.io/datui-apt/public.key | sudo gpg --dearmor -o /usr/share/keyrings/datui-archive-keyring.gpgecho "deb [signed-by=/usr/share/keyrings/datui-archive-keyring.gpg] https://derekwisong.github.io/datui-apt/ ./" | sudo tee /etc/apt/sources.list.d/datui.list -
Update the
aptcache and install:sudo apt update sudo apt install datui
Install from a .deb File
Download the .deb file for the release version you want from the Latest Release.
Use apt to install that file:
apt install datui-X.Y.Z-1.x86_64.deb
Compiling from Source
Datui is built using Rust, leveraging its Cargo toolkit for compilation.
To compile a release-quality executable, clone the repository and use cargo to build:
git clone https://github.com/derekwisong/datui.git
cd datui
cargo build --release
If desired, before building you could check out a specific release tag
git tag --list
git checkout <tag from the list>
cargo build --release
The datui executable can be found in the target/release directory.
Run it directly, or copy the file to a location on your PATH environment variable to make it
discoverable by your terminal.
Using cargo install
You may use cargo to install Datui locally into Cargo’s binary cache. (The ~/.cargo/bin
directory on Linux).
cargo install --path .
Quick Start
Datui is used to visualize tabular data in the terminal.
See the Installation Manual for help installing Datui.
Opening a File
To open a file, simply provide it as an argument.
datui /path/to/file.csv
Datui will load your data into a full screen terminal display.
See the Loading Data section for details about supported file formats and options.
Navigating
You may scroll through your data using the arrow keys, or familiar vim keybindings (j/k for
up/down, h/l for left/right).
You may also jump pages with the Page Up and Page Down keys.
Getting Help
See command line arguments:
datui --help
Activate the built-in help display at any time by pressing ? or F1 (F1 works
in text fields too, e.g. query input). Press Esc or ? to close it.
Understanding the UI
- The main Datui view window shows your data in full screen, with a header row at the top and a toolbar across the bottom of the screen.
- The toolbar at the bottom contains a quick reference for the keystrokes to activate the various features of Datui.
- Certain features will open pop-over menus, or change the full screen view. Press
Escto go back to the prior page.
More Examples
Open a hive-partitioned directory:
datui --hive /path/to/directory
Note: The directory should contain files all of the same type
Or, a glob pattern to hive-partitioned parquet:
datui --hive "/path/to/directory/**/*.parquet"
Note: It is usually necessary to quote the glob pattern to prevent shell expansion.
Learning More
Now that you understand the basics, learn about the rest of Datui’s features by reading the User Guide.
User Guide
See the Reference section for the details of the command line options, keyboard shortcuts, and query syntax.
Configuring Datui
Datui can be configured to your preferences and needs. Set up a configuration file to make it just right for your environment.
See the Configuration Guide for details.
Loading Data
To learn about the supported formats and features when loading a dataset with Datui, see the Loading Data Guide.
Charts
Render charts in the terminal and export them to images. See the Charting Guide for details.
Exporting Data
See Exporting Data for a guide to exporting to common formats.
Dataset Info
See the Dataset Info Guide to find out about the schema and resources of your dataset.
Querying, Filtering, and Sorting
Query Syntax
Datui’s query syntax makes filtering, grouping, and aggregating your dataset easy. You can also use it to make drilling down into subgroups of your data simple.
To learn more about it, see the Querying Data Guide.
Filtering and Sorting Dialogs
In addition to a query language, filtering and sorting can be done by using a dialog window in the TUI. See Filtering and Sorting for more.
Pivot and Melt
See the Pivot and Melt Guide to learn about reshaping your data.
Save your Work with Templates
Save and reapply your queries, sorts, and transformations using the Templates system. Templates save your customizations so they can be quickly re-applied later to the same or similar files.
Analysis Features
Use tools to explore characteristics or extract insight from your data.
- Discover relationships with a correlation matrix
- Learn about the characteristics of your data with distribution analysis
See the Analysis Features for full details.
The Home Screen
Run datui with no arguments to open the home screen: a list of datasets, with
what each contains shown before you open it. Ctrl+O returns
here from anywhere.
 datui                                                         ~/work/analysis
› ▏  type to filter
▾ RECENT
▸ sales                          hive      2.4M × 18    340 MB    2d
  customers.parquet                          89k × 12     4 MB    1w
▾ /mnt/data                                        network · configured
  events                         hive       1.1M × 9    120 MB    3h
  lookup.parquet                              980 × 4     8 KB    2mo
▾ ~/work/analysis                                     current directory
  raw_export.csv                                        1.2 GB    3h
  notes/                         dir
Enter Open  ↑↓ Move  Esc Quit  type Filter  ~ Path  ←→ Fold  Tab Sort
Keys
| key | action |
|---|---|
| ↑ ↓ / k j | move |
| ← → / h l | collapse / expand the section |
| Enter | open the dataset, enter the directory, or fold the section |
| type anything | filter by name (fuzzy: sal matches sales) |
| ~ | type a path directly; Tab completes it |
| Backspace | delete a filter character, or leave a directory |
| Tab | cycle the sort: default, size, modified, rows |
| Delete | forget the highlighted entry (under RECENT only) |
| Shift+Delete | forget every recent entry, after confirming |
| Ctrl+U | clear the filter |
| Esc | back out one layer: clear filter, leave directory, return to your data, quit |
| Ctrl+C | quit |
| Ctrl+O | return here from anywhere, including during a load |
q does not quit here — plain characters go into the filter. The control bar shows what Esc will do next.
Where the list comes from
The list is grouped by root — a directory datui looks in. Sections appear in this order:
| # | section | source | shown when empty |
|---|---|---|---|
| 1 | RECENT | datasets you have opened, most recent first | no |
| 2 | the current directory | where you launched datui | yes |
| 3 | a configured directory | [data] directories, in the order you list them | yes |
| 4 | directories of recent datasets | added when you open something | no |
| 5 | ELSEWHERE | desktop places | no |
Where you are comes first: a directory holding sixty recently-opened files would
otherwise push the place you just cd’d into off the screen.
A directory reached more than one way appears once, under the earliest of these that names it.
Sections fold with ← and →. A folded section shows how many rows it is hiding, and stays folded until you expand it or restart datui.
Filtering keeps the grouping, so a match always shows which root it came from.
Reaching somewhere new
~ opens a path input, and Tab completes what you type — as far as the candidates agree, and no further. A lone directory gains its trailing slash, so a second Tab steps into it. When several match, the count is shown.
Opening something this way adds the directory holding it to the list, so a place only has to be found by hand once.
Adding a root
Name it in your config. This is the only explicit way, and the only one that
keeps a place listed when it is empty or its mount is down (it shows as
unavailable rather than disappearing):
[data]
directories = ["/mnt/data", "~/datasets", "$WORK/warehouse"]
~ and $VAR are expanded.
Otherwise roots accumulate on their own: opening a dataset adds the directory holding it, so somewhere on a mount only has to be found by hand once. Press ~ to type a path, open something, and the place is listed from then on. Roots gathered this way disappear again when they hold nothing.
Desktop places
datui reads freedesktop’s recently-used.xbel — written by file managers and GTK
applications — and offers the directories it mentions. Never the file names:
those places are listed unexpanded under ELSEWHERE, and their contents appear
only after you press Enter.
  ELSEWHERE                        opened elsewhere · press Enter to look
    ~/Downloads/                 dir
datui reads that file, never writes to it, and sends nothing anywhere. To ignore it:
[data]
use_desktop_recents = false
Searching below where you are
Typing filters the rows already on screen. It also starts a recursive search of the
working directory, and datasets found below it appear in a Found section
under everything else.
The walk runs once, in the background, the first time you type. Every keystroke after that filters the result in memory, so the search gets no slower as you narrow it. Nothing is walked if you never type — launching datui, pressing Enter on a recent dataset and leaving costs nothing.
How matching works
datui scores fuzzy matches the way fzf does, using fzf’s own constants and its
path scheme. That is deliberate: anyone reaching for a fuzzy filter already has one
calibrated in their fingers, and a finder that ranks differently feels broken rather
than different. It is the same scoring fzf, fzf-lua, Telescope with
telescope-fzf-native, and neovim’s snacks.picker all use.
What that means in practice:
| behaviour | example |
|---|---|
a match after / or _ beats one mid-word | sales prefers a/b/sales.csv to zzsalesz.csv |
| consecutive beats scattered | abc prefers abc.csv to a_b_c.csv to axbxc.csv |
| a match in the file name beats one in a directory | sales prefers archive/old/sales.csv to sales/2024/report.csv |
| the best alignment wins, not the first found | revdetail marks revenue_detail, not the re in warehouse |
| ties go to the shorter name | sales prefers sales.csv to sales_by_region_and_quarter.csv |
That last-but-one row is the one people notice. A left-to-right greedy matcher would
underline re inside warehouse; every mainstream finder tries every starting
position and keeps the best-scoring one, and so does datui.
The characters your filter matched are underlined in each row, so you can see why a result is there — useful when a fuzzy match lands somewhere you did not expect. A row that matched on a column rather than its name has the highlight on the column note instead, since marks scattered over an unrelated filename would read as the filter having gone wrong.
Results are named by their path below the search root, because three files called
sales.parquet are indistinguishable otherwise:
Found   ~/work/analysis · 954 searched
  europe/q3/sales.parquet          12.4 MB   1.2M rows   3 days ago
  americas/q3/sales.parquet         9.1 MB   890K rows   3 days ago
The heading says how much was searched, and says when the walk stopped early —
partial · out of time, partial · too many, partial · too deep. A search that
quietly returned less than the truth would be worse than no search, because “it is
not here” is something you act on.
What is skipped, and why not .gitignore
datui does not read .gitignore. People gitignore data directories precisely
because the data is too big to commit — which is the same reason they want to open it
in datui. Measured on datui’s own repository, honouring .gitignore hides 38 real
test datasets while hiding 69 files of virtualenv noise. Wrong in both directions.
The noise is handled structurally instead:
| rule | effect |
|---|---|
| hidden directories are skipped | .git, .venv, .tox, the caches |
| a fixed name list | node_modules, target, build, dist, vendor, site-packages, __pycache__, venv, env |
| filesystem boundaries are not crossed | a search never wanders onto a mount |
| symlinks are not followed | no loops, no escaping the tree |
The name list matters more than it looks: node_modules and site-packages are full
of .json, which datui can open, so without it every package manifest on the machine
is a search result. In datui’s own tree the list cuts the entries examined from 15,177
to 306 and finds exactly the same 80 datasets.
Not crossing filesystems is the limit that keeps the home screen fast. It is what
stops a walk from descending onto a network share, and on a machine using autofs, from
mounting one merely by looking at it. The cost is that data on a mount beneath your
working directory will not be found by the search — turn cross_filesystems on if
that is where your data lives and you know the mount is fast.
Tuning it
[data.search]
enabled           = true
max_depth         = 8
max_results       = 20000
time_budget_ms    = 1500
cross_filesystems = false
follow_gitignore  = false
skip       = ["node_modules", "target", "build", "dist", "vendor",
              "site-packages", "__pycache__", "venv", "env"]
skip_extra = []
extensions = []
- skip replaces the default list entirely; skip_extra adds to it, so putting one directory out of reach does not mean restating the other nine.
- extensions empty means every format datui can open — which includes
jsonandtxt. Narrow it to["parquet", "csv"]if a source tree is too noisy. - time_budget_ms is what makes a cold or enormous tree degrade to partial results rather than to a wait.
Details
rows, columns and size say what a dataset is. None of them say what reading it
will do, and the difference is large: 200 MB of zstd-compressed Parquet is two
gigabytes once open, and two gigabytes over a hotel-wifi NFS mount is a different
afternoon than two gigabytes on tmpfs.
The preview pane shows both, in one list:
 DETAILS
source      nfs4
kind        hive
rows        412M
columns     38
on disk     184 MB
in memory   1.4 GB  zstd 7.6×
row groups  12
partitions  1,460 by date, region
            date 2021-01-01 to 2024-12-31
modified    3 days ago
| line | where it comes from | why it matters |
|---|---|---|
source | the kernel’s mount table | nfs4, cifs and fuse.sshfs fail in three different ways, and none behaves like tmpfs |
in memory | the Parquet footer | what it will occupy, as against what it occupies on disk |
row groups | the Parquet footer | one enormous group cannot be read in parallel or skipped through; a thousand tiny ones cost more overhead than they save |
partitions | directory names | the shape of a partitioned dataset, knowable without opening a single file |
None of it costs an extra byte of the dataset. The mount table is a kernel-generated file — reading it cannot block on the filesystem it describes, which is why it is safe to ask about a share that has stopped answering. The compression and layout figures come out of the same footer datui already reads for the row count. The partition layout is directory names.
source is the filesystem’s own name and nothing else — colour carries the warning,
so a remote or object-store source stands out without a sentence explaining that a
network is a network. Sections name the filesystem too, so nfs4 · recent replaces a
bare network.
A dataset directory reports no size rather than the size of its own inode. Two hundred
bytes is what stat says about a directory holding a terabyte, and printing it reads
as an answer.
Sorting
Tab cycles how rows are ordered inside each section. The control bar names the order currently in effect where the cursor is:
- the default suits each section —
recentunderRECENT,nameunder a directory size,modifiedandrowsorder every section the same way
Rows with nothing to sort by go last rather than counting as zero, so size does not
open with a page of datasets whose size has not been read yet.
While a dataset is loading
Pressing Enter leaves this screen immediately, and what replaces it is the load in progress, not the dataset you had open before:
                            ⣷  Caching schema…

                              events.parquet
                       ~/data/events.parquet   120 MB
The phase names a real step — scanning the input, caching the schema, filling the first buffer — so a load that is slow still shows where it has got to. Ctrl+O abandons it and comes back here; Esc from here then returns you to whatever was open before, which is untouched.
When a dataset will not open
datui shows what went wrong and returns you to this screen with the reason, so the next choice is one keystroke away rather than a dead end:
› corrupt▏ …parquet: 'parquet scan': the file must end with PAR1
Network locations
The home screen never reads a network location on the thread that draws it. An
unreachable NFS share does not fail, it blocks — for seconds on a soft mount, and
indefinitely on a hard one, which is the default and cannot be interrupted. So a
root on a network filesystem, and any s3://, gs:// or https:// path, is
recognised from its name and the mount table alone, without being reached for.
The consequence is that datui starts at the same speed whether the network is there
or not. A remote root appears immediately, marked network · checking, and is
listed in the background:
▾ /mnt/data                                        network · configured
  events                         hive       1.1M × 9    120 MB    3h
▾ s3://bucket/warehouse                         network · checking
A remote dataset datui has measured before shows its counts and columns straight
away, from the cache. One it has not shows its name and nothing else until the
listing arrives — size, counts and type all require reading it. A location that
never answers is marked unavailable and not retried.
Remembered facts for a remote dataset are used without re-checking, since checking
means a stat on a path that may not answer. A stale row count is a better answer
than an empty one for the datasets that are hardest to reach. Local datasets are
verified against size and modification time, and re-measured when either changes.
Object-store and HTTP URLs are recorded in RECENT like any other path, and are
worth having there: s3://bucket/warehouse/events/year=2024 is the sort of path
worth not retyping.
Finding a dataset by its columns
Typing into the filter matches dataset names and column names. Searching
customer_id finds every dataset that has such a column, with the match shown
against the row:
› customer_id▏
▾ RECENT  2
▸ sales                 ·customer_id      2.4M × 18    340 MB    2d
  orders.parquet        ·customer_id        89k × 12     4 MB    1w
A name match always ranks above a column match, so typing a dataset’s name still finds the dataset.
Column names come from the Parquet footer datui already reads to get row counts, so this costs nothing extra — and they are remembered between runs, so a search works immediately on a cold start without reading anything.
Columns are known for Parquet datasets that have been measured at least once. Formats that need a scan to read a schema are matched by name only.
What counts as a dataset
| on disk | shown as |
|---|---|
customers.parquet | one dataset |
sales/year=2024/…, sales/year=2025/… | one row, sales · hive |
exports/ holding several matching Parquet files | one row, exports · multi |
| a directory of source code with a stray CSV in it | a directory to enter |
| a network path not yet listed | openable, with no type shown until it is |
Reading the columns
sales          hive     2.4M × 18     340 MB     2d
                        rows × cols   size       last modified
Row and column counts come from Parquet footers, summed across at most 64 files for
hive and multi-file datasets. A dataset larger than that shows ? × 39 — its width
is known, its length is not. Formats that need a scan to count rows (CSV among them)
show neither.
Rows are measured a few per frame, and only those on screen, so a directory of large datasets appears immediately and the counts fill in. Measurements are kept for the session.
The preview pane shows the full schema for Parquet datasets, each type in the colour the table will use.
Loading
Ctrl+O works while a dataset is loading; scanning runs off the interface thread.
Leaving a load abandons it rather than cancelling it. The scan runs to completion in the background and its result is discarded — it cannot overwrite whatever you open instead, but it does use CPU until it finishes.
Narrow terminals
The screen adapts rather than truncating. Below roughly 100 columns the preview pane yields so the list keeps its size and shape columns, and below about 56 those columns go too. The control bar is ordered so that if it has to be cut, what survives is how to open, move and leave.
What datui remembers
Two things, both in the cache directory:
- Recently opened paths, so the list has somewhere to start.
- What it measured — row and column counts, and column names — each stamped with the size and modification time it was taken from, so a dataset that has changed invalidates itself.
Delete forgets a single entry under RECENT — for an experiment, a file
that would not open, or something you would rather not have on screen. Only under
RECENT: a row inside a directory is a real file, and datui does not delete files.
Shift+Delete forgets the whole list. It asks first — it sits
next to the key that forgets one entry, and an accidental press should not silently
discard every place you have been. datui --clear-recents does the same from the
command line.
datui --clear-cache clears everything, including measurements and query history.
Both are caches, not a catalogue. There is nothing to register, nothing to curate,
and nothing that cannot be rebuilt by looking again. datui --clear-cache removes
both, and costs only speed.
Everything else on this screen is read fresh, on a background thread, never on the one drawing the screen.
Limits
The home screen stays the same speed whether you have used datui for a day or a year. Every kind of work it does is capped:
| work | limit |
|---|---|
| recently opened paths kept | 50 |
| directories promoted to roots by a recent | the 8 most recent distinct ones |
| entries listed from one directory | 5,000 |
| subdirectories looked inside, per listing | 64 |
| files looked at to tell whether a directory is a dataset | 8 |
| files read to count the rows of a multi-file dataset | 64 |
| datasets measured at once | 12, and only ones on screen |
| network directories probed at once | 4 |
| depth of the recursive search | 8 |
| datasets a recursive search returns | 20,000 |
| wall clock for one recursive search | 1.5 s |
The caps that change what you see say so. A directory cut short reads first 5000
beside its name. A subdirectory past the 64 is still listed — it just shows as a
directory rather than as a dataset until you step into it, at which point it is
classified normally.
The two that matter most are the root cap and the subdirectory cap, because both bound round trips, which is what costs time on a network share. Fifty scattered recents once meant fifty directory listings on every rebuild; a directory of two thousand subdirectories meant roughly eighteen thousand filesystem operations to list it once. Neither is possible now.
Older places do not disappear — they stay under RECENT as individual datasets,
and any path is still reachable by typing it.
Plain terminals
On a terminal without a UTF-8 locale, datui falls back to ASCII:
  > _  type to filter

  RECENT
  > sales                        hive       2.4M x 18    340 MB    2d
Override the detection with:
[display]
unicode = "auto"    # "auto" (default), "always", or "never"
Named keys are spelled out — Enter, Tab, Bksp, Esc — matching the rest of
datui and avoiding symbols that many terminal fonts do not carry. Only the arrows are
drawn as glyphs, and they fall back with everything else.
No Nerd Font characters are used anywhere, so no patched font is needed.
Desktop launchers
datui installs /usr/share/applications/datui.desktop, so it appears in GNOME,
KDE, rofi, wofi and Omarchy’s menu under Apps. Its keywords include data,
parquet, dataframe and csv.
Launching with no file opens the home screen. The entry declares the formats datui
reads, so a file manager offers “Open with datui” for them; which application is
the default for a format stays your choice in mimeapps.list.
See Also
- Configuration —
[data] directoriesand the rest - Theming from Your System
- Loading Data — opening datasets from the command line
Configuration
Datui supports extensive customization through TOML configuration files. You can customize colors, defaults, performance settings, and more.
Quick Start
Generate a default configuration file:
datui --generate-config
This creates ~/.config/datui/config.toml with all available options and helpful comments.
Configuration File Location
- Linux:
~/.config/datui/config.toml - macOS:
~/.config/datui/config.toml - Windows:
%APPDATA%\datui\config.toml
Configuration Priority
Settings are applied in this order (later values override earlier ones):
- Default values (hardcoded)
- Imported files (each entry of
import, in the order listed — see below) - Config file (
~/.config/datui/config.toml) - Command-line arguments (highest priority)
Importing Other Config Files
The top-level import key names TOML files to merge in before this file’s own
settings:
# ~/.config/datui/config.toml
import = ["~/.local/state/omarchy/current/theme/datui.toml"]

[display]
row_numbers = true
- Order is precedence. Imports apply in the order listed, each overriding the last; this file’s own values are applied after all of them.
- Imports nest. An imported file may declare its own
import, merged before it. Chains are capped at 8 files; a cycle is an error. - Paths may be absolute, relative to the importing file, or use
~and$VAR/${VAR}. - A missing file is skipped with a warning on stderr — datui starts on the remaining layers.
- A file that exists but cannot be read or parsed is fatal, and datui names it.
To stop following an imported theme, delete the import line.
See Theming from Your System for the Omarchy template and per-theme overrides.
A caveat when overriding an imported color
datui decides whether you set a color by comparing it against the built-in default, so a color set to the same value as datui’s default looks unset and will not override an import.
datui’s default error is red. Given an import setting error to #FF5345,
writing error = "red" has no effect. Use a form the default does not already
use — #ff0000, or indexed(9).
Colors set to any other value override imports normally.
Configuration Sections
File Loading Defaults
Customize how data files are loaded:
[file_loading]
delimiter = 44        # CSV delimiter (44 = comma). null = auto-detect
has_header = true     # Whether files have headers. null = auto-detect
skip_lines = 0        # Lines to skip at file start
skip_rows = 0         # Rows to skip when reading
parse_dates = true    # When true (default), CSV reader tries to parse string columns as dates (e.g. YYYY-MM-DD, ISO datetime)
decompress_in_memory = false  # When true, decompress compressed CSV into memory; when false (default), decompress to a temp file so scan can be used
temp_dir = null       # Directory for temp files when decompressing compressed CSV. null = system default (e.g. /tmp)
infer_schema_length = 1000   # Rows to use when inferring CSV column types. Default 1000; higher reduces risk of wrong type (e.g. int then N/A)
ignore_errors = false # When true, CSV reader skips rows that fail to parse instead of failing the load
- delimiter — ASCII value of the CSV column separator (e.g. 44 for comma). Omit or set to
nullto use auto-detection. - has_header — Whether the first row is a header. Omit or
nullfor auto-detect;trueorfalseto force. - skip_lines / skip_rows — Number of lines (or rows) to skip before reading the header and data.
- parse_dates — When
true(default), the CSV reader attempts to parse string columns that look like dates (e.g.YYYY-MM-DD,YYYY-MM-DDTHH:MM:SS) into Polars Date or Datetime. Set tofalseto keep such columns as strings. Overridden by the--parse-datesCLI flag (e.g.--parse-dates falseto disable; see command-line options). - decompress_in_memory — When
false(default), compressed CSV is decompressed to a temporary file so the lazy CSV reader can scan it. Whentrue, compressed data is decompressed into memory (eager load). Usetrueif you have no temp filesystem. Overridden by--decompress-in-memory/--decompress-in-memory false. - temp_dir — Directory used for temporary files when decompressing compressed CSV. Omit or set to
nullto use the system default (e.g./tmpon Unix). Overridden by the--temp-dirCLI option. - infer_schema_length — Number of rows used to infer CSV column types (default 1000). If a column looks like integers in the first N rows but later has a non-numeric value (e.g.
N/A), increasing this or adding that value to null_values avoids parse errors. Overridden by--infer-schema-length. - ignore_errors — When
false(default), a CSV parse error (e.g. wrong type) fails the load. Whentrue, the reader skips rows that fail to parse. Overridden by--ignore-errors.
Display Settings
Control how data is displayed:
[display]
pages_lookahead = 3   # Pages to buffer ahead (smoother scrolling)
pages_lookback = 3    # Pages to buffer behind
row_numbers = false   # Show row numbers on left side
row_start_index = 1   # Starting index for row numbers (0 or 1)
table_cell_padding = 1   # Spaces between columns in the main table (>= 0)
align_numeric_right = true   # Right-align numeric columns and their headers
number_format = "none"       # Digit grouping — see below
Example: Enable row numbers starting at 0
[display]
row_numbers = true
row_start_index = 0
Number formatting
Large integers — genomic coordinates, row counts, IDs — are hard to read as an
unbroken run of digits. number_format adds digit grouping:
[display]
number_format = "thousands"   # 1,234,567
Press F in the data table to toggle formatting on and off at any
time. The toggle is session-only; the config file decides the state at launch.
With the default "none", F turns on comma grouping.
| Preset | Renders 1234567.89 as |
|---|---|
none (default) | 1234567.89 |
thousands | 1,234,567.89 |
european | 1.234.567,89 |
si | 1 234 567.89 (narrow no-break space, ISO 31-0) |
swiss | 1'234'567.89 |
indian | 12,34,567.89 (lakh / crore) |
underscore | 1_234_567.89 |
For finer control, replace the shorthand with a table:
[display.number_format]
grouping = "thousands"     # none | thousands | indian | system | any preset above
group_separator = ","
decimal_separator = "."
floats = true              # group float columns too
float_precision = 2        # omit to keep the file's own decimal rendering
exclude_columns = ["*_id", "year"]   # never format these (globs: * and ?)
Every value in a formatted column is grouped, with no size threshold — a
column never mixes 1000 and 248,956,422. Uniform treatment of a column reads
better in a table than the prose convention of leaving four-digit numbers alone.
exclude_columns is how you keep a column plain. Use it for columns that
are numeric but are not quantities — years, sample IDs, ZIP codes, accession
numbers:
[display.number_format]
grouping = "thousands"
exclude_columns = ["year", "*_id", "zip"]
Why formatting is not taken from your locale
By default datui never reads LC_NUMERIC or LANG to decide how to render
numbers. A data file has no locale, so the same file should look the same on
your laptop and over SSH on a cluster — and LC_NUMERIC is unset or C on much
of the infrastructure this feature is aimed at, so detection would silently do
nothing exactly where it was wanted. Proper locale formatting also needs
ICU/CLDR data, which is megabytes for a tool that ships as a single binary.
The presets above cover the same conventions explicitly. If you do want the environment consulted, opt in:
[display.number_format]
grouping = "system"   # reads LC_ALL / LC_NUMERIC / LANG, falls back to "thousands"
What formatting does and does not affect
Formatting is display-only. Exported files, query and filter expressions, templates, and group-by keys always use raw values — what you see grouped on screen is written out ungrouped.
The control bar’s row count and the info panel’s totals are datui’s own labels rather than your data, so they always group and ignore both this setting and the F toggle.
Numeric alignment
align_numeric_right (default true) renders integer and float columns, and
their headers, flush right so magnitudes line up. Strings, booleans and
temporal columns stay left-aligned. Set it to false for the pre-0.2.56
appearance:
[display]
align_numeric_right = false
Unlike grouping, alignment is on by default: it changes neither the characters of a value nor a column’s width, so nothing reflows and copied text is identical.
Performance Settings
Tune performance and responsiveness:
[performance]
# sampling_threshold = 10000   # Optional: when set, sample datasets >= this size for analysis
event_poll_interval_ms = 25  # UI polling interval (lower = more responsive)
- event_poll_interval_ms — UI event polling interval in milliseconds. Lower values feel more responsive but use more CPU.
sampling_threshold (optional)
Controls whether Analysis Mode uses a sample of the data for large datasets. Default: sampling is off (full dataset is used).
| Config / CLI | Behavior |
|---|---|
Omit sampling_threshold in config (default) | Full dataset is used. No “Resample” keybind or “(sampled)” label. |
sampling_threshold = N in config | For datasets with ≥ N rows, analysis runs on a sample (faster, less memory). r resamples; tool shows “(sampled)”. |
--sampling-threshold N on the command line | Overrides config for that run. Use a positive N to enable sampling, or 0 to force full-dataset analysis. |
Example: to sample only when a table has at least 50,000 rows, set sampling_threshold = 50000 under [performance], or run datui --sampling-threshold 50000 …. See command-line options for the CLI flag.
Chart View
Default limit for how many rows are used when building chart data (display and export). You can also change this in chart view with the Limit Rows option.
[chart]
row_limit = 10000  # Max rows for chart data (1 to 10_000_000). Default 10000
Data
[data]
directories = ["/mnt/data", "~/datasets"]   # roots for the home screen
use_desktop_recents = true                  # offer directories from the desktop's recent-files list
- directories — directories the home screen lists datasets
from.
~and$VARare expanded; order is preserved. Directories you open datasets from are added automatically, so this is for places you have not visited yet, and for places you want listed even when empty. - use_desktop_recents — when
true(default), directories named in freedesktop’srecently-used.xbelare offered as places to enter. Only the directories are used, never the file names. Setfalseto ignore that file.
Searching below the working directory
Typing on the home screen also searches recursively beneath it. The walk runs once, in the background, on the first keystroke; everything after that is filtered in memory.
[data.search]
enabled           = true    # search below the working directory when you type
max_depth         = 8       # how deep to descend
max_results       = 20000   # stop after this many datasets
time_budget_ms    = 1500    # give up and keep what was found
cross_filesystems = false   # do not descend onto a different filesystem
follow_gitignore  = false   # do not read .gitignore
skip_extra        = []      # directory names to skip beyond the defaults
extensions        = []      # empty = every format datui opens
- cross_filesystems — off by default, and the most important setting here: it is what keeps a search from wandering onto a network share, and on autofs, from mounting one merely by looking at it.
- follow_gitignore — off by default and deliberately, because people gitignore data directories precisely because the data is too big to commit. See the home screen guide.
- skip / skip_extra —
skipreplaces the default list (node_modules,target,build,dist,vendor,site-packages,__pycache__,venv,env);skip_extraadds to it. Hidden directories are always skipped.
Theme Mode (light and dark terminals)
Some of datui’s colors — header fills, alternating row stripes, borders, dim text — need to sit near the terminal background without matching it. No ANSI color means “slightly off from the background”, so those slots resolve to fixed shades, and a set tuned for a dark terminal is unreadable on a light one.
[theme]
mode = "auto"   # "auto" (default), "dark", or "light"
- auto — reads the
COLORFGBGenvironment variable, falling back todark. - dark / light — pick a set explicitly.
Alacritty, Kitty and Ghostty do not set COLORFGBG. If you use a light terminal
color scheme in one of those, set mode = "light" — otherwise the header bar and
row striping will render as near-black blocks on your light background.
mode only chooses the starting point; any color you set under [theme.colors]
overrides it. An imported theme can also declare mode, which is how a generated
light theme gets light chrome automatically — see
Theming from Your System.
Color Themes
Customize the entire UI appearance:
[theme.colors]
keybind_hints = "cyan"              # Keybind hints
keybind_labels = "yellow"           # Action labels
primary_chart_series_color = "cyan" # Chart data
secondary_chart_series_color = "dark_gray" # Chart theory
chart_series_color_1 = "cyan"       # Chart view: first series
chart_series_color_2 = "magenta"    # Chart view: second series
chart_series_color_3 = "green"      # Chart view: third series
chart_series_color_4 = "yellow"    # Chart view: fourth series
chart_series_color_5 = "blue"      # Chart view: fifth series
chart_series_color_6 = "red"       # Chart view: sixth series
chart_series_color_7 = "bright_cyan" # Chart view: seventh series
error = "red"                       # Error messages
success = "green"                   # Success indicators
warning = "yellow"                  # Warnings
dimmed = "dark_gray"                # Dimmed elements
alternate_row_color = "default"    # Background for every other row ("default" = off, or a color name)
Color Formats
Three color formats are supported:
1. Named Colors
keybind_hints = "cyan"
error = "bright_red"
dimmed = "dark_gray"
background = "default"  # Use terminal default background
text_primary = "default"  # Use terminal default text color
Available names:
- Basic:
black,red,green,yellow,blue,magenta,cyan,white - Bright:
bright_red,bright_green,bright_blue, etc. - Grays:
gray,dark_gray,light_gray - Special:
resetordefault(uses terminal default colors - works in both light and dark themes)
2. Hex Colors
background = "#1e1e1e"
sidebar_border = "#007acc"
controls_bg = "#2d2d2d"
- Format:
#rrggbb(6 hex digits) - Case-insensitive:
#FF0000or#ff0000 - Automatically adapted to your terminal’s capabilities
3. Indexed Colors
controls_bg = "indexed(236)"  # Example: specific palette entry
surface = "indexed(239)"
- Direct reference to xterm 256-color palette (0-255)
- Respects your terminal’s color scheme
- Useful for matching specific terminal themes
Terminal Compatibility
Colors automatically adapt to your terminal:
- True color terminals (Alacritty, kitty, iTerm2): Hex colors display exactly
- 256-color terminals (xterm-256color): Hex converted to nearest palette match
- Basic terminals (8/16 colors): Colors map to nearest ANSI color
- Monochrome: Set
NO_COLOR=1to disable colors - Light Theme Support:
- The default values for
backgroundandtext_primaryare set to"default" - Datui will inherit your terminal’s default colors
- The application renders correctly in both light and dark terminal themes
- Be aware that setting explicit colors like
"black"or"white"may result in poor visibility in certain terminal themes
- The default values for
Available Colors
All UI colors can be customized:
| Color | Purpose | Default |
|---|---|---|
keybind_hints | Keybind hints (modals, breadcrumb, correlation matrix) | cyan |
keybind_labels | Action labels in controls bar | yellow |
throbber | Busy indicator (spinner) in control bar | cyan |
primary_chart_series_color | Chart data (histogram bars, Q-Q plot data points) | cyan |
secondary_chart_series_color | Chart theory (histogram overlays, Q-Q plot reference line) | dark_gray |
chart_series_color_1 … chart_series_color_7 | Chart view: series colors (line/scatter/bar) | cyan, magenta, green, yellow, blue, red, bright_cyan |
success | Success indicators, normal distributions | green |
error | Error messages, outliers | red |
warning | Warnings, skewed distributions | yellow |
dimmed | Dimmed elements, axis lines | dark_gray |
background | Main background | default (uses terminal default) |
surface | Modal/surface backgrounds | default (uses terminal default) |
controls_bg | Controls bar and table header backgrounds | indexed(235) |
text_primary | Primary text | default (uses terminal default) |
text_secondary | Secondary text | dark_gray |
text_inverse | Text on light backgrounds | black |
table_header | Table column header text | white |
table_header_bg | Table column header background | indexed(235) |
column_separator | Vertical line between table columns | cyan |
table_selected | Selected row style | reversed |
sidebar_border | Sidebar borders | dark_gray |
modal_border_active | Active modal elements | yellow |
modal_border_error | Error modal borders | red |
distribution_normal | Normal distribution indicator | green |
distribution_skewed | Skewed distribution indicator | yellow |
distribution_other | Other distribution types | white |
outlier_marker | Outlier indicators | red |
Query System
Configure query behavior:
[query]
history_limit = 1000      # Max queries to remember
enable_history = true     # Enable query history
Template Settings
Configure template behavior:
[templates]
auto_apply = false  # Auto-apply most relevant template on file open
Debug Settings
Configure debug overlay:
[debug]
enabled = false             # Show debug overlay by default
show_performance = true     # Show performance metrics
show_query = true           # Show LazyFrame query
show_transformations = true # Show transformation state
Example Configurations
Minimal Configuration
Simple customization for common preferences:
version = "0.2"

[display]
row_numbers = true
row_start_index = 0

[theme.colors]
keybind_hints = "blue"
Dracula Theme
Complete Dracula color scheme using the official palette (hex colors):
version = "0.2"

[theme.colors]
# Keybinds and UI chrome
keybind_hints = "#bd93f9"              # Purple
keybind_labels = "#ff79c6"             # Pink
throbber = "#bd93f9"                   # Purple

# Chart colors
primary_chart_series_color = "#bd93f9" # Purple
secondary_chart_series_color = "#6272a4" # Comment
chart_series_color_1 = "#8be9fd"       # Cyan
chart_series_color_2 = "#ff79c6"       # Pink
chart_series_color_3 = "#50fa7b"       # Green
chart_series_color_4 = "#f1fa8c"       # Yellow
chart_series_color_5 = "#bd93f9"       # Purple
chart_series_color_6 = "#ff5555"       # Red
chart_series_color_7 = "#ffb86c"       # Orange

# Status
success = "#50fa7b"                    # Green
error = "#ff5555"                      # Red
warning = "#ffb86c"                    # Orange
dimmed = "#6272a4"                     # Comment

# Backgrounds
background = "#282a36"                 # Background
surface = "#44475a"                    # Selection / current line
controls_bg = "#44475a"                # Controls bar

# Text
text_primary = "#f8f8f2"               # Foreground
text_secondary = "#6272a4"             # Comment
text_inverse = "#282a36"               # Background (for inverse)

# Table
table_header = "#f8f8f2"               # Foreground
table_header_bg = "#44475a"            # Selection
row_numbers = "#6272a4"                # Comment
column_separator = "#bd93f9"           # Purple
table_selected = "reversed"
alternate_row_color = "default"        # No stripe (or use "#3d3f4a" for subtle stripe)

# Column type colors (when column_colors enabled)
str_col = "#50fa7b"                    # Green
int_col = "#8be9fd"                    # Cyan
float_col = "#bd93f9"                  # Purple
bool_col = "#f1fa8c"                  # Yellow
temporal_col = "#ff79c6"               # Pink
binary_col = "dark_gray"               # Binary column ‹binary› placeholder (always applied, shown italic)

# Borders and modals
sidebar_border = "#6272a4"             # Comment
modal_border_active = "#ff79c6"        # Pink
modal_border_error = "#ff5555"         # Red

# Cursor (query input, etc.)
cursor_focused = "#f8f8f2"             # Foreground
cursor_dimmed = "#6272a4"              # Comment

# Analysis / distributions
distribution_normal = "#50fa7b"        # Green
distribution_skewed = "#ffb86c"        # Orange
distribution_other = "#f8f8f2"         # Foreground
outlier_marker = "#ff5555"             # Red
Performance Tuned
Optimize for large datasets:
version = "0.2"

[display]
pages_lookahead = 5   # More buffering for smoother scrolling
pages_lookback = 5

[performance]
sampling_threshold = 50000  # Optional: sample only datasets >= 50k rows (omit to use full data)
event_poll_interval_ms = 16 # ~60 FPS polling (more responsive)
High Contrast Theme
Using named colors for maximum compatibility:
version = "0.2"

[theme.colors]
keybind_hints = "bright_cyan"
keybind_labels = "bright_yellow"
primary_chart_series_color = "bright_cyan"
secondary_chart_series_color = "dark_gray"
error = "bright_red"
success = "bright_green"
warning = "bright_yellow"
dimmed = "dark_gray"

background = "black"
controls_bg = "dark_gray"
text_primary = "bright_white"
Command-Line Overrides
CLI arguments always override config file settings:
# Config has row_numbers = true, but disable for this run:
datui data.csv --row-numbers=false

# Override page buffering:
datui data.csv --pages-lookahead 10

# Override delimiter:
datui data.csv --delimiter=9  # Tab character (ASCII 9)
Managing Configuration
View Current Config
Your config file is at ~/.config/datui/config.toml. Edit it with any text editor:
# Linux/macOS
nano ~/.config/datui/config.toml
vim ~/.config/datui/config.toml
code ~/.config/datui/config.toml

# Windows
notepad %APPDATA%\datui\config.toml
Reset to Defaults
Regenerate the default config file:
datui --generate-config --force
This overwrites your existing config with a fresh template.
Remove Configuration
Simply delete the config file:
# Linux/macOS
rm ~/.config/datui/config.toml

# Windows
del %APPDATA%\datui\config.toml
Datui will use default values when no config file exists.
Troubleshooting
Config Not Loading
If your config isn’t being used:
- Check file location: Ensure config is at
~/.config/datui/config.toml - Check syntax: TOML must be valid. Run
datui <file>and check for warnings - Check version: Config must start with
version = "0.2" - Check validation: Ensure values are in valid ranges (e.g., if set,
sampling_threshold > 0) - Check imports: If you use
import, a missing file is reported on stderr — rundatui <file> 2>/tmp/datui.logand read the log after quitting
Imported Theme Not Applying
If an import does not seem to take effect:
- Confirm the file exists at the resolved path. A missing import is skipped with a warning on stderr, which the TUI hides while it is running — redirect stderr to a file to see it.
- Confirm the value differs from datui’s default. A color set to the same string as datui’s default cannot override an import — see the caveat above.
- Confirm nothing later overrides it. Your own config file and any command-line flags both win over an imported file.
Invalid Color
If you see an error about invalid colors:
Error: Invalid color value for 'keybind_hints': Unknown color name: 'notacolor'
Solutions:
- Use valid color names (see list above)
- Use hex format:
#ff0000 - Use indexed format:
indexed(236) - Check spelling and case (names are case-insensitive)
Config Parse Error
If TOML parsing fails:
Error: Failed to parse config file: expected newline, found ...
Solutions:
- Check TOML syntax at https://toml.io/
- Ensure proper quotes around strings
- Verify no typos in section names
- Regenerate config:
datui --generate-config --force
Colors Look Wrong
If colors don’t look right:
- Check terminal capabilities: Some terminals don’t support true color
- Try named colors: More portable than hex colors
- Try indexed colors: Match your terminal’s palette exactly
- Check NO_COLOR: Unset with
unset NO_COLORif colors are disabled
Table Headers or Toolbar Text Cut Off or Deformed (VS Code, xterm-256)
On some terminals (e.g. VS Code integrated terminal, xterm-256color), custom background colors on headers/toolbar can cause text to render cut off or deformed. By default, controls_bg and table_header_bg use indexed(235), which works well on most setups.
If you see deformed text, set them to "default" or "none" for no custom background:
[theme.colors]
controls_bg = "default"
table_header_bg = "default"
See Also
- Command-Line Options - CLI flags that override config
- Quick Start Guide - Getting started with datui
- Keyboard Shortcuts - Available keybindings
Theming datui from your system
datui can follow a theme generated by something else on your machine — a desktop
theme manager, chezmoi, home-manager, or a dotfiles repo — through
import. It detects no
particular system; you point import at the file yours generates.
Light and dark terminals
Some colours (header fills, row striping, borders, dim text) sit near the terminal background rather than matching it, and resolve to fixed shades. A set tuned for a dark terminal is unreadable on a light one.
[theme]
mode = "auto"   # "auto" (default), "dark", or "light"
auto reads COLORFGBG and falls back to dark. Alacritty, Kitty and Ghostty do
not set it, so on a light colour scheme in those terminals, set
mode = "light".
Colours under [theme.colors] override whichever set mode chooses.
Omarchy
Omarchy renders per-app theme files from templates on
omarchy theme set. datui ships one.
-
Install the template:
mkdir -p ~/.config/omarchy/themed cp contrib/omarchy/datui.toml.tpl ~/.config/omarchy/themed/ -
Import the file Omarchy will generate:
# ~/.config/datui/config.toml import = ["~/.local/state/omarchy/current/theme/datui.toml"] -
Apply a theme:
omarchy theme set tokyo-night
The template sets theme.mode from the theme’s own polarity, so light themes get
light chrome. A theme switch takes effect the next time datui starts; a running
instance keeps the theme it launched with.
Overriding colours
Your own config.toml wins over anything imported:
import = ["~/.local/state/omarchy/current/theme/datui.toml"]

[theme.colors]
int_col = "#ff8800"     # applies on every theme
A colour set to the same string as datui’s default will not override an import — see the caveat.
Overriding one theme only
Add a second import, and a file in that theme’s directory:
# ~/.config/datui/config.toml
import = [
  "~/.local/state/omarchy/current/theme/datui.toml",
  "~/.local/state/omarchy/current/theme/datui.override.toml",
]
# ~/.config/omarchy/themes/osaka-jade/datui.override.toml
[theme.colors]
int_col   = "#ff8800"
float_col = "#ff00ff"
Omarchy copies your theme directory into the theme state directory before rendering templates, so the file arrives untouched. Themes without one lack the file, and datui skips a missing import with a warning on stderr.
Name it
datui.override.toml. A file nameddatui.tomlreplaces the generated file rather than layering onto it, dropping every colour it does not restate.
What changes
Backgrounds, borders, header fills and row striping follow the theme.
Column-type colours will look much as they did before. datui’s defaults for those are ANSI names, which your terminal already resolves from the same theme. On near-monochrome themes several column types look alike; the per-theme override above is the way out.
Other systems
Only the paths above are Omarchy-specific:
import = ["~/.local/share/mytheme/datui.toml"]
The imported file uses datui’s config format and may set any section, not just
[theme.colors].
See Also
- Configuration —
importprecedence rules
Loading Data
Load data with Datui by passing it command line options
and a path to open. The path can be a local file or directory, an S3 URI (Amazon S3 or MinIO), a GCS URI (gs://), or an HTTP/HTTPS URL. Cloud and HTTP support are included by default.
Remote data (S3, GCS, and HTTP)
You can open data from Amazon S3, Google Cloud Storage (GCS), S3-compatible storage (e.g. MinIO), or HTTP/HTTPS by passing the appropriate URI. Support is included by default when you build or install datui.
Same behavior for all cloud and HTTP: Parquet (and Parquet globs/prefixes) are read directly where supported; all other formats (CSV, JSON, NDJSON, etc.) are downloaded to a temporary file first, then loaded. That applies to AWS S3, custom S3 (MinIO, etc.), and GCS.
One remote path at a time: If you pass more than one path and the first is a remote URL (S3, GCS, or HTTP), datui reports an error. Open a single remote URL per run; local files can still be opened as multiple paths (concatenated).
Amazon S3 (s3://)
Credentials: Datui does not add its own credential system. It uses the same credentials as the rest of the AWS ecosystem:
-
Environment variables (good for scripts and one-off use):
AWS_ACCESS_KEY_ID— access keyAWS_SECRET_ACCESS_KEY— secret keyAWS_REGION(orAWS_DEFAULT_REGION) — e.g.us-east-1- Optionally
AWS_SESSION_TOKENfor temporary credentials
-
Shared config (good for daily use):
~/.aws/credentials— profiles and keys~/.aws/config— region and other settings
-
IAM roles — If you run on EC2, ECS, Lambda, or similar, the instance/task role is used automatically; no env or config needed.
Set at least one of these before running Datui. Example:
export AWS_ACCESS_KEY_ID=AKIA...
export AWS_SECRET_ACCESS_KEY=...
export AWS_REGION=us-east-1
datui s3://my-bucket/data/myfile.parquet
Usage
-
Single Parquet file:
datui s3://bucket-name/path/to/file.parquet -
Hive-style partitioned data on S3:
Use a prefix or glob so Polars can discover partitions:datui s3://bucket-name/prefix/datui "s3://bucket-name/prefix/**/*.parquet"
-
Other formats (CSV, JSON, NDJSON, etc.) on S3:
Datui downloads the object to a temporary file and then loads it like a local file. Use the same URI style:datui s3://bucket-name/path/to/file.csv
The file is downloaded to your system temp directory (or--temp-dirif set), then opened normally. This is the same approach used for HTTP/HTTPS URLs.
Configurable S3 (MinIO and other S3-compatible backends)
You can point S3 at a custom endpoint (e.g. MinIO) via config, environment variables, or CLI options. Priority is: CLI > env > config. That lets you keep a default in config and override per run when you use multiple backends.
Config — In ~/.config/datui/config.toml add a [cloud] section:
[cloud]
# MinIO example
s3_endpoint_url = "http://localhost:9000"
s3_access_key_id = "minioadmin"
s3_secret_access_key = "minioadmin"
s3_region = "us-east-1"
Environment variables (override config; standard for S3 tools):
AWS_ENDPOINT_URLorAWS_ENDPOINT_URL_S3— custom endpoint (e.g.http://localhost:9000)AWS_ACCESS_KEY_ID— access keyAWS_SECRET_ACCESS_KEY— secret keyAWS_REGIONorAWS_DEFAULT_REGION— region (e.g.us-east-1)
CLI options (override env and config):
--s3-endpoint-url URL--s3-access-key-id KEY--s3-secret-access-key SECRET--s3-region REGION
Examples for multiple backends without editing config each time:
# MinIO in another terminal/shell
export AWS_ENDPOINT_URL=http://localhost:9000
export AWS_ACCESS_KEY_ID=minioadmin
export AWS_SECRET_ACCESS_KEY=minioadmin
export AWS_REGION=us-east-1
datui s3://my-bucket/file.parquet

# Different MinIO or S3-compatible endpoint
datui --s3-endpoint-url https://s3.other.example s3://other-bucket/file.parquet
Google Cloud Storage (gs://)
You can open Parquet files from Google Cloud Storage using gs:// URIs. Credentials use Application Default Credentials:
- User or service account key file: set
GOOGLE_APPLICATION_CREDENTIALSto the path of your JSON key file. - gcloud CLI: run
gcloud auth application-default login. - GCE/Cloud Run: workload identity is used automatically.
Example:
export GOOGLE_APPLICATION_CREDENTIALS=/path/to/key.json
datui gs://my-bucket/path/to/file.parquet
- Parquet and Hive-style prefixes/globs work as for S3:
datui gs://bucket/prefix/ordatui "gs://bucket/prefix/**/*.parquet". - Other formats (CSV, JSON, NDJSON, etc.) work the same as S3 and HTTP: the object is downloaded to a temporary file, then loaded. Example:
datui gs://my-bucket/path/to/file.csv
Minimal build (no cloud)
To build without S3 support and avoid the extra cloud dependencies:
cargo build --release --no-default-features
If you pass an S3 or gs:// URI to a binary built that way, you will see an error suggesting a build with default features.
Supported Formats
| Format | Extensions | Eager load only | Hive partitioning |
|---|---|---|---|
| Parquet | .parquet | No | Yes |
| CSV (or other-delimited) | .csv, .tsv, .psv, etc. | No | No |
| NDJSON | .jsonl | No | No |
| JSON | .json | Yes | No |
| Arrow IPC / Feather v2 | .arrow, .ipc, .feather | No | No |
| Avro | .avro | Yes | No |
| Excel | .xls, .xlsx, .xlsm, .xlsb | Yes | No |
| ORC | .orc | Yes | No |
Eager load only — The file is read fully into memory before use; no lazy streaming. Hive partitioning — Use the --hive flag with a directory or glob; see Hive-partitioned data below.
Excel — Use the --sheet flag to specify which sheet to open.
CSV date inference — By default, CSV string columns that look like dates (e.g. YYYY-MM-DD, YYYY-MM-DDTHH:MM:SS) are parsed as Polars Date/Datetime. Use --parse-dates false or set parse_dates = false in configuration to disable.
Binary columns
Binary (blob) columns often hold large values (e.g. raw document bytes) that are slow to read and not meaningful to print. The table shows a ‹binary› placeholder instead of the bytes — rendered dim and italic — so scrolling and jump-to-end stay fast. The underlying bytes are still read for exports and analysis. Customize the placeholder color with binary_col in configuration.
Compression
Compressed files are identified by extension and decompressed before loading. Use the --compression option to specify the format when the file has no extension or the extension is wrong.
Supported Compression Formats
- gz
- zstd
- bzip2
- xz
Hive-partitioned data
You can load a Hive-style partitioned dataset (e.g. a directory tree with key=value segment names such as year=2024/month=01/) by using the --hive flag and passing a directory or a glob pattern instead of a single file.
- Directory: point at the partition root, e.g.
datui --hive /path/to/data - Glob: use a pattern that matches the partition layout, e.g.
datui --hive /path/to/data/**/*.parquet
You may need to quote the glob so your shell does not expand it (e.g.datui --hive "/path/to/data/**/*.parquet").
Only Parquet is supported for hive-partitioned loading. If you pass a single file with --hive, it is loaded as usual and the flag is ignored.
Schema from one file (default): For faster loading, datui infers the Parquet schema from a single file along one partition branch (single-spine) instead of scanning all files. This applies to both local Hive directories and S3/GCS prefixes (e.g. s3://bucket/prefix/ or gs://bucket/prefix/). If your dataset has inconsistent schemas or other complications and you prefer Polars to discover the schema over all files, disable this with --single-spine-schema=false or set single_spine_schema = false under [file_loading] in configuration.
Partition columns (the keys from the path, e.g. year, month) are shown first in the table and listed in the Info panel under the Partitioned data tab.
Querying Data
Press / to open the query prompt. The prompt has three tabs:
- SQL-Like — Datui’s built-in query language (described below).
- Fuzzy — Filter rows by typing text; matches any string column, tokens AND, case-insensitive (see Fuzzy search).
- SQL — Run standard SQL against the current table (see Using the SQL tab).
Use Tab or Shift+Tab (or Left / Right) to switch tabs. Focus stays on the tab bar when you change tabs; press Tab to move focus into the text input for the selected tab.
See the Query Syntax Reference for additional detail about the structure of SQL-Like queries.
Fuzzy search
In the Fuzzy tab, type text and press Enter to filter rows. The search matches any string column: characters must appear in order (not necessarily adjacent). Space-separated words are ANDed (each must match). Matching is case-insensitive. Up / Down — browse fuzzy search history. Esc — cancel.
Using the SQL tab
When the SQL tab is selected and focus is in the input box, you can run SQL against the current data. The table is registered as df, so use FROM df in your queries.
- Up / Down — Browse SQL history (stored separately from SQL-Like history).
- Enter — Run the query (or submit an empty line to reset the view to the full table).
- Esc — Cancel and close the prompt.
Example:
SELECT * FROM df LIMIT 100
SELECT category, COUNT(*) AS n FROM df GROUP BY category ORDER BY n DESC
Selecting Columns (SQL-Like)
The select clause can be used to select columns:
select a, b, c
Use select alone to select all columns:
select
Rename columns using the : assignment operator (creates a column d that is the same as a):
select a, b, c, d: a
To create, or query, columns with spaces in their names, use the col["name"] syntax:
select no_spaces:col["name with spaces"]
or
select col["name with space"]: no_spaces
Filtering Results
The where clause can be used to filter results.
select where a > 10
Separate where clause expressions with , (logical and).
Get all data where a > 10 and b < 2:
select where a > 10, b < 2
Use the | to form a logical or between a bool column and a numeric:
select where some_bool | a > 10
Select a, b, and c where a > 10 and b < 2 and (d > 7 or e = 2)
select a, b, c where a > 10, b < 2, (d > 7) | (e = 2)
Calculations and Transformations
There is a simple expression language built-in to the query language using:
+, -, *, and % for arithmetic (the % is division, not modulo).
select a, b: c+d where c > 0
See the Syntax Reference for important details about the expression syntax.
Working with dates and times
For columns of type Date or Datetime, use dot accessors to extract components:
select event_date: timestamp.date, year: timestamp.year
select where created_at.date > 2024.01.01, created_at.month = 12
select order_date, order_date.month, order_date.dow by order_date.year
Use YYYY.MM.DD for date literals in comparisons (e.g. where dt_col.date > 2021.01.01).
Available accessors include date, time, year, month, week, day, dow (day of week), month_start, month_end, and tz (timezone). See the Query Syntax Reference for the full list and more examples.
Grouping and Aggregation
The by clause in the query language allows you to group your data, or aggregate it within group.
Enabling Drill-Down with Grouping
Executing a query with a by clause will result in a grouped table. This table can be drilled down into
through the UI by selecting the resultant grouped row and pressing Enter. Go back to the grouped result
by pressing Esc.
select name, city, state, salary by department
Aggregate Queries
Using the same by syntax, you can introduce an aggregation function to summarize your data.
select min_salary: min salary, avg_salary: avg salary, max_salary: max salary by department
Filtering and Sorting
Open the Sort & Filter dialog with s. The dialog has two tabs:
Sorting demo:
Filtering demo:
- Sort: Manage column order, sort order, locking, and visibility.
- Filter: Add and manage row filters (column, operator, value).
Use Tab / Shift+Tab to move focus; Left / Right on the tab bar to switch tabs. Apply runs changes and closes the dialog; Cancel closes without applying; Clear resets the current tab.
Exporting Data
The data export controls can be used to save your data to a file.
Press the e key from the main window to export your data. See
Keyboard Shortcuts.
Supported Formats
You can export to: CSV, Parquet, JSON, NDJSON, Arrow IPC (.arrow), and Avro (.avro).
Excel is supported for loading only, not export.
See Loading Data for the full list of input formats.
Chart View
The chart view supports multiple chart types using tabs across the top: XY, Histogram, Box Plot, KDE, and Heatmap.
Press c from the main view to open the chart.
Controls in Chart View
- Tab bar: Switch chart type with ←/→ when the tab bar is focused.
- XY:
- Plot style: Line, Scatter, or Bar (cycle with ↑/↓ or ←/→ when focused).
- X axis: Search for and select a numeric or temporal column (single selection).
- Y axis: Search for and select one or more numeric columns. Use
Spaceto toggle columns on or off; up to seven series can be plotted at once. - Options:
- Y axis starts at 0 (defaults to data range)
- Log scale
- Show legend
- Histogram:
- Value column: Select a numeric column.
- Bins: Adjust with
+/-or ←/→ when focused.
- Box Plot:
- Value column: Select a numeric column.
- KDE:
- Value column: Select a numeric column.
- Bandwidth: Adjust with
+/-or ←/→ when focused.
- Heatmap:
- X axis / Y axis: Select numeric columns.
- Bins: Adjust with
+/-or ←/→ when focused.
- Limit Rows (all chart types, at bottom of options): Maximum rows used to build the chart. Adjust with
+/-or ←/→ when focused. Default comes from config (chart.row_limit, typically 10,000). Tab/Shift+Tabmove focusEscreturns to the main view
Export to File
Press e to open the chart export dialog.
- Choose format
- Enter a file path
- Press
Enteror navigate to theExportbutton to export.
If the file already exists, you will be asked to confirm overwrite.
Extensions (like
.png,.eps) are added automatically if missing.
Configuration
- Series colors: In
theme.colors, setchart_series_color_1throughchart_series_color_7. See Configuration. - Default row limit: In
[chart], setrow_limit(e.g.10000) to change the default maximum rows used for chart data. You can override it in the UI with Limit Rows.
Dataset Info Panel
The Info panel shows technical details about the loaded dataset. Press i from the main view to open it. Esc or i closes it.
Navigation (when the panel is open):
- Tab / Shift+Tab: On the Schema tab, move focus between the tab bar and the schema table. On the Resources tab, focus stays on the tab bar.
- Left / Right: On the tab bar, switch between Schema and Resources.
- ↑ / ↓: When the schema table has focus (Schema tab), scroll the column list and change the selection. The first row is selected by default when the Schema tab is active.
Tabs
Schema
- Rows (total) and Columns: Size of the full dataset (not the visible slice).
- Columns by type: Counts per data type (e.g.
Int64: 3 · Utf8: 2). - Schema: Known / Inferred: Parquet uses a stored schema (Known); CSV and JSON infer types (Inferred).
- Column table: Name, type, source, and for Parquet files optionally Compression (codec and ratio per column).
Resources
- File size: Size on disk (when loaded from a file).
- Buffered (visible): Estimated memory of the currently buffered slice (not the full dataset).
- Parquet: Overall compression ratio, row groups, version, and Created by when available.
- Format: Detected format (CSV, Parquet, JSON, NDJSON).
See also
Analysis Mode
Use Datui to get insights about your data.
If you configure a sampling threshold (see Configuration), analysis uses a subset of the data when the dataset is large. In that case the tool shows “(sampled)” and you can press
rto resample.By default, analysis uses the full dataset (no sampling).
Starting Analysis Mode
Open analysis mode using the a key.
See Keyboard Shortcuts for more key bindings.
You will see a collection of tools on the right. Using the Tab key to navigate to the list,
select a tool to analyze your data with. The Describe tool is selected by default.
To exit analysis mode, press the Esc key.
Tools
Describe
Displays summary statistics about your data, similar to Polars’ describe.
Distribution Analysis
- Compares your data against a set of hypothetical distributions and suggests the best fit.
- Select a column and press
Enteron it to view a Q-Q plot and a histogram for the column.
Correlation Matrix
Discover the relationships in your data with the correlation matrix tool. Colors are used to note the degree of correlation.
Pivot and Melt
Datui supports reshaping tabular data between long and wide formats via the Pivot & Melt dialog.
Open it with p from the main view.
Pivot demo:
Melt demo:
- Pivot (long → wide): Turn rows with a key column into new columns. Example:
id,date,key,value→id,date,key_A,key_B,key_C. - Melt (wide → long): Collapse many columns into
variableandvaluecolumns. Example:id,Q1,Q2,Q3→id,variable,value.
Both operations run on the current table—i.e. the result of any filters, sorts, or queries you’ve applied. You can filter or sort first, then pivot or melt that view.
Pivot (long → wide)
Pivoting a table is by nature an eager operation. To form the columns, the data must be read. Be sure to filter or query the data as appropriate before pivoting to manage memory usage.
- Index columns: Group columns that stay on the left (e.g.
id,date). Use the filter to search, Space to toggle selection. Order matters. - Pivot column: The column whose distinct values become new column headers (e.g.
key→A,B,C). Use ↑/↓ to select. - Value column: The column whose values fill the new cells. Use ↑/↓ to select.
- Aggregation: How to combine multiple values per group: last, first, min, max, avg, med, std, count. Default is last. If the value column is string-typed, only first and last are available.
New column names (from the pivot column’s values) are always sorted alphabetically.
Apply runs the pivot and closes the dialog. Cancel or Esc closes without changing the table. Clear resets the form.
Melt (wide → long)
- Index columns: Columns to keep as identifiers (e.g.
id,date). Same multi-select pattern as Pivot. - Value-column strategy:
- All except index: Melt every column not in the index. Good default when you want to unpivot all measure columns.
- By pattern: Regex over column names (e.g.
Q[1-4]_2024,metric_.*). Type the pattern in the Pattern field. - By type: Melt all Numeric, String, Datetime, or Boolean columns (excluding index).
- Explicit list: Manually pick value columns with Space to toggle.
- Variable name / Value name: Output column names for the melted dimension and values. Defaults:
variable,value.
Apply runs the melt and closes the dialog. Cancel or Esc closes without applying. Clear resets the form.
Keyboard Shortcuts
- Tab / Shift+Tab: Move focus (tab bar → form fields → Apply → Cancel → Clear → tab bar).
- Left / Right: On the tab bar, switch between Pivot and Melt. In text fields (filter, pattern, variable/value names), move the cursor.
- ↑ / ↓: Move selection in lists (index, pivot, value, aggregation, strategy, type, explicit list).
- Space: Toggle selection in index and explicit value lists.
- Enter: Activate focused control (Apply, Cancel, Clear).
- Esc: Close dialog without applying.
- ? / F1: Show help (F1 works in text fields).
Templates
Pivot and melt settings can be saved in templates. When you save a template from the current view (e.g. after applying a pivot or melt), the reshape spec is stored. Applying that template (e.g. with T for the most relevant template, or from the template manager) will run query → filters → sort → pivot or melt → column order in that order, so the same reshape is applied appropriately in the lazyframe processing flow.
Templates
Datui’s templates allow you to store the queries, filters, and transformations you have applied. This way, you can re-use them with other datasets!
Creating a Template
- To save a template, press the
tkey to load the template dialog - Press
sto save the template - Enter a name and an optional description
- Use the dialog to set additional options and save the template
Loading a template
To load a template, press the t key to load the template dialog. Select the
desired template from the list and press Enter to load it.
Automatically Load Best-Fit Template
Templates are scored against your dataset by a few characteristics to determine if they can be applied to your loaded dataset. The template dialog will indicate the fit with a symbol on the left-most column of the list.
You may automatically load the best-fit template using the T (capital-T) keybind.
Notes
- Templates save at most one query type at a time: the Query tab (DSL), the SQL tab, or the Fuzzy tab. Whichever one is active when you save is the one stored. Filters, sort, column order, pivot/melt, and other settings are saved regardless.
Python Module
Datui is distributed on Pypi.
Install using pip:
pip install datui
Viewing a LazyFrame or DataFrame
View your LazyFrame (or DataFrame) in the terminal:
import polars as pl
import datui

# From a LazyFrame (e.g. scan)
lf = pl.scan_csv("data.csv")
datui.view(lf)
Press q to exit Datui.
Reference
This section contains information about specific topics.
- Customize with Command Line Options
- See an overview of Keyboard Shortcuts
- Learn about the Datui Query Syntax
Command Line Options
Usage
Usage: datui [OPTIONS] [PATH]...
Options
| Option | Description |
|---|---|
[<PATH>] | Path(s) to the data file(s) to open. Multiple files of the same format are concatenated into one table (not required with –generate-config, –clear-cache, or –remove-templates) |
--skip-lines <SKIP_LINES> | Skip this many lines when reading a file |
--skip-rows <SKIP_ROWS> | Skip this many rows when reading a file |
--skip-tail-rows <N> | Skip this many rows at the end of the file (e.g. to ignore vendor footer or trailing garbage) |
--no-header <NO_HEADER> | Specify that the file has no header |
--delimiter <DELIMITER> | Specify the delimiter to use when reading a delimited text file |
--infer-schema-length <N> | Number of rows to use when inferring CSV schema (default: 1000). Larger values reduce risk of wrong type (e.g. int then N/A) |
--ignore-errors <BOOL> | When reading CSV, ignore parse errors and continue with the next batch (default: false) |
--null-value <VAL> | Treat these values as null when reading CSV. Use once per value; no “=” means all columns, COL=VAL means column COL only (first “=” separates column from value). Example: –null-value NA –null-value amount= |
--compression <COMPRESSION> | Specify the compression format explicitly (gzip, zstd, bzip2, xz) If not specified, compression is auto-detected from file extension |
--format <FORMAT> | Force file format (parquet, csv, tsv, psv, json, jsonl, arrow, avro, orc, excel). By default format is auto-detected from the file extension. Use this for URLs or paths without an extension |
--debug | Enable debug mode to show operational information |
--hive | Enable Hive-style partitioning for directory or glob paths; ignored for a single file |
--single-spine-schema <BOOL> | Infer Hive/partitioned Parquet schema from one file for faster load (default: true). Set to false to use full schema scan |
--parse-dates <BOOL> | Try to parse CSV string columns as dates (e.g. YYYY-MM-DD, ISO datetime). Default: true |
--parse-strings <COL> | Trim whitespace and parse CSV string columns as date, datetime, time, duration, int, or float. Default: applied to all string columns. Use –parse-strings=COL (repeatable) to limit to specific columns, or –no-parse-strings to disable |
--no-parse-strings | Disable parse-strings for CSV (trim and type inference). Overrides config and default |
--decompress-in-memory <DECOMPRESS_IN_MEMORY> | Decompress into memory. Default: decompress to temp file and use lazy scan |
--temp-dir <DIR> | Directory for decompression temp files (default: system temp, e.g. TMPDIR) |
--sheet <SHEET> | Excel sheet to load: 0-based index (e.g. 0) or sheet name (e.g. “Sales”) |
--clear-cache | Clear all cache data and exit |
--template <TEMPLATE> | Apply a template by name when starting the application |
--remove-templates | Remove all templates and exit |
--sampling-threshold <N> | When set, datasets with this many or more rows are sampled for analysis (faster, less memory). Overrides config [performance] sampling_threshold. Use 0 to disable sampling (full dataset) for this run. When omitted, config or full-dataset mode is used |
--polars-streaming <BOOL> | Use Polars streaming engine for LazyFrame collect when available (default: true). Set to false to disable |
--workaround-pivot-date-index <BOOL> | Apply workaround for Polars 0.52 pivot with Date/Datetime index (default: true). Set to false to test without it |
--pages-lookahead <PAGES_LOOKAHEAD> | Number of pages to buffer ahead of the visible area (default: 3) Larger values provide smoother scrolling but use more memory |
--pages-lookback <PAGES_LOOKBACK> | Number of pages to buffer behind the visible area (default: 3) Larger values provide smoother scrolling but use more memory |
--row-numbers | Display row numbers on the left side of the table |
--row-start-index <ROW_START_INDEX> | Starting index for row numbers (default: 1) |
--column-colors <BOOL> | Colorize main table cells by column type (default: true). Set to false to disable |
--number-format <FORMAT> | Digit grouping for numbers in the data table (default: none). Press F to toggle while running. “system” reads LC_ALL/LC_NUMERIC/LANG and picks a matching style |
--align-numeric-right <BOOL> | Right-align numeric columns and their headers (default: true). Set to false to left-align |
--generate-config | Generate default configuration file at ~/.config/datui/config.toml |
--force | Force overwrite existing config file when using –generate-config |
--s3-endpoint-url <URL> | S3-compatible endpoint URL (overrides config and AWS_ENDPOINT_URL). Example: http://localhost:9000 |
--s3-access-key-id <KEY> | S3 access key (overrides config and AWS_ACCESS_KEY_ID) |
--s3-secret-access-key <SECRET> | S3 secret key (overrides config and AWS_SECRET_ACCESS_KEY) |
--s3-region <REGION> | S3 region (overrides config and AWS_REGION). Example: us-east-1 |
Keyboard Shortcuts
In the main view, the following keyboard shortcuts are available.
Busy state: When the app is working (loading data, scrolling, exporting, analysis, pivot/melt), a throbber appears in the control bar.
Navigation (main table):
| Key | Action |
|---|---|
↑ / ↓ or j / k | Move selection one row |
← / → or h / l | Scroll columns |
Home | Jump to first row |
End or G | Jump to last row |
Page Up / Page Down | Scroll one page |
Ctrl-F / Ctrl-B | Page down / page up |
Ctrl-D / Ctrl-U | Half page down / half page up |
: | Go to line: type a line number and press Enter (e.g. :0 Enter for first row); Esc to cancel |
Actions:
| Key | Action |
|---|---|
/ | Query input (See Querying Data) |
p | Open Pivot & Melt controls (See Pivot and Melt) |
s | Open Sort & Filter controls (See Sorting and Filtering) |
e | Open export controls (See Exporting Data) |
a | Open the analysis tools (See Analysis Features) |
c | Open Chart view (See Charting) |
t | Open template manager (See Templates) |
T | Apply most relevant template |
i | Open Info panel (modal); Tab / Shift+Tab move focus (tab bar ↔ schema table); Left / Right switch tabs (See Dataset Info) |
r | Reset (clear query, filters, sort) |
q | Quit |
? / F1 | Help (F1 works in text fields, e.g. query input) |
Display toggles:
These change how the current view is drawn. They take effect immediately and last for the session only — the config file decides the state at launch.
| Key | Action |
|---|---|
N | Toggle row numbers |
F | Toggle number formatting — thousands separators (See Configuration) |
Note for Alacritty users: If F1 does nothing, ensure F1 is not bound in ~/.config/alacritty/alacritty.toml. You can still use ? for help when not in a text field.
Query Syntax Reference
This document details the syntax of the Datui query language. For examples and typical workflows, see Querying Data.
Structure of a query
A query has the form:
select [columns] [by group_columns] [where conditions]
select— Required. Starts every query. May be followed by nothing (select all columns), or a comma‑separated list of column expressions.by— Optional. Grouping and aggregation. Everything afterbyup towhere(if present) is the group specification.where— Optional. Filtering. Everything afterwhereis the filter expression.
Clause order is fixed: select → by → where. The parser splits on the keywords where and by (respecting parentheses and brackets), so you cannot reorder or repeat clauses.
The : assignment (aliasing)
Use : to name an expression. The form is name : expression:
- Left of
:— The new column or group name. Must be an identifier (e.g.total) orcol["name with spaces"]. - Right of
:— The expression (column reference, literal, arithmetic, function call, etc.).
Examples:
select a, b, sum_ab: a + b
select renamed: col["Original Name"]
by region_name: region, total: sales + tax
Assignment is supported in both the select and by clauses. In by, it defines computed group keys or renames (e.g. region_name: region, total: sales + tax). Expressions may use column references, arithmetic, literals, and function calls.
Columns with spaces in their names
Identifiers cannot contain spaces. For columns (or aliases) with spaces, use col["..."] or col[identifier]:
select col["First Name"], col["Last Name"]
select no_spaces: col["name with spaces"]
Inside the brackets use either a quoted string ("name with spaces") or a single identifier (no spaces). The same syntax works in select, by, and where.
Right‑to‑left expression parsing
Expressions are parsed right‑to‑left: the leftmost binary operator is the root, and the right subexpression is parsed first (so it effectively binds tighter).
What this means
a + b * c→ parsed asa + (b * c)(multiplication binds tighter).a * b + c→ parsed asa * (b + c)(*is leftmost; the right subexpressionb + cis parsed as a unit).
So “higher‑precedence”‑style grouping happens when you put those operations on the right. You can often avoid parentheses by ordering:
select x, y: a * b + c    →  a * (b + c)
select x, y: a + b * c    →  a + (b * c)
Using parentheses
Use () to override grouping:
select (a + b) * c
select a, b where (x > 1) | (y < 0)
Parentheses also matter for , and | in where: splitting on comma and pipe respects nesting, so you can wrap ORs (or more complex logic) in () and then combine with commas. See Where clause: , and |.
Select clause
selectalone — All columns, no expressions.select a, b, c— Those columns (and/or expressions), in order.select a, b: x + y, c— Columns and aliased expressions.
Columns are separated by ,. Each item is either a plain expression or alias : expression. The same expression rules (arithmetic, col[], functions, etc.) apply everywhere.
By clause (grouping and aggregation)
by col1, col2— Group by those columns. Non‑group columns become list columns; the UI supports drill‑down.by region, total: sales + tax— Group byregionand a computed expression (e.g. arithmetic).select avg salary, min id by department— Aggregations per group.
By uses the same comma‑separated list and name : expression rules as select. Aggregation functions (avg, min, max, count, sum, std, med) can be written as fn[expr] or fn expr (brackets optional).
Where clause: , and |
The where clause combines conditions using two separators:
,— AND. Each comma‑separated segment is one ANDed condition.|— OR. Within a single comma‑separated segment,|separates alternatives that are ORed together.
Parsing order:
- Split the where part on
,(respecting()and[]). Each segment is ANDed. - Within each segment, split on
|. The pieces are ORed.
So:
where a > 10, b < 2→(a > 10) AND (b < 2).where a > 10 | a < 5→(a > 10) OR (a < 5).where a > 10 | a < 5, b = 2→(a > 10 OR a < 5) AND (b = 2).
Interaction of , and |
, has broader scope than |: it splits the where clause into top‑level AND terms. | only groups within one of those terms. So:
A, B | C=A AND (B OR C).A | B, C | D=(A OR B) AND (C OR D).
To express (A or B) and (C or D), use (A)|(B), (C)|(D). Parentheses keep | inside each AND term. For more complex logic, use () to group OR subexpressions, then separate those groups with ,.
Comparison operators
In where conditions, each comparison operator compares a left-hand expression (often a column) to a right-hand expression (column, literal, or expression).
| Operator | Meaning | Example |
|---|---|---|
= | Equal | where a = 10 |
!= | Not equal | where a != 0 |
<> | Not equal (same as !=) | where a <> 0 |
< | Less than | where a < 100 |
> | Greater than | where a > 5 |
<= | Less than or equal | where a <= 10 |
>= | Greater than or equal | where a >= 1 |
Operators and literals
- Arithmetic:
+-*%(%is division, not modulo). - Comparison: See Comparison operators (where clauses) above.
- Literals: Numbers (
42,3.14), strings ("hello",\"for embedded quotes), date literals (2021.01.01in YYYY.MM.DD format), timestamp literals (2021.01.15T14:30:00.123456in YYYY.MM.DDTHH:MM:SS[.fff…] format; fractional seconds set precision: 1–3 digits = ms, 4–6 = μs, 7–9 = ns). - Coalesce:
^— first non-null from left to right.a^b^c= coalesce(a, b, c). Right-to-left binding:a^b^c=a^(b^c).
Date and datetime accessors
For columns of type Date or Datetime, use dot notation to extract components:
column_ref.accessor
Datetime accessors
Apply to Datetime columns (with or without timezone):
| Accessor | Result | Description |
|---|---|---|
date | Date | Date part (year-month-day) |
time | Time | Time part (Polars Time type) |
year | Int32 | Year |
month | Int8 | Month (1–12) |
week | Int8 | Week number |
day | Int8 | Day of month (1–31) |
dow | Int8 | Day of week (1=Monday … 7=Sunday, ISO) |
month_start | Datetime/Date | First day of month at midnight |
month_end | Datetime/Date | Last day of month |
format["fmt"] | String | Format as string (chrono strftime, e.g. "%Y-%m") |
Date accessors
Apply to Date columns:
| Accessor | Result | Description |
|---|---|---|
year | Int32 | Year |
month | Int8 | Month (1–12) |
week | Int8 | Week number |
day | Int8 | Day of month |
dow | Int8 | Day of week (1=Monday … 7=Sunday) |
month_start | Date | First day of month |
month_end | Date | Last day of month |
format["fmt"] | String | Format as string (chrono strftime) |
String accessors
Apply to String columns:
| Accessor | Result | Description |
|---|---|---|
len | Int32 | Character length |
upper | String | Uppercase |
lower | String | Lowercase |
starts_with["x"] | Boolean | True if string starts with x |
ends_with["x"] | Boolean | True if string ends with x |
contains["x"] | Boolean | True if string contains x |
Accessor aliases
When you use an accessor on a column, the result is automatically aliased to {column}_{accessor} (e.g. timestamp.date → timestamp_date). This avoids duplicate column names and keeps results clear.
Syntax examples
Select:
select event_date: timestamp.date
select col["Created At"].date, col["Created At"].year
select name, event_time.time
select order_date, order_date.month, order_date.dow by order_date.year
Where (with date literal YYYY.MM.DD, timestamp literal):
select where created_at.date > other_date_col
select where dt_col.date > 2021.01.01
select where ts_col > 2021.01.15T14:30:00.123456
select where event_ts.month = 12, event_ts.dow = 1
select where city_name.ends_with["lanta"]
select where null col1
select where not null col1
Select (coalesce, string accessors, format):
select a: coln^cola^colb
select name.len, name.upper, dt_col.format["%Y-%m"]
Functions
Functions are used for aggregation (typically in select with by) and for logic in where. Write fn[expr] or fn expr; brackets are optional.
Aggregation functions
| Function | Aliases | Description | Example |
|---|---|---|---|
avg | mean | Average | select avg[price] by category |
min | — | Minimum | select min[qty] by region |
max | — | Maximum | select max[amount] by id |
count | — | Count of non-null values | select count[id] by status |
sum | — | Sum | select sum[amount] by year |
first | — | First value in group | select first[value] by group |
last | — | Last value in group | select last[value] by group |
std | stddev | Standard deviation | select std[score] by group |
med | median | Median | select med[price] by type |
len | length | String length (chars) | select len[name] by category |
Logic functions
| Function | Description | Example |
|---|---|---|
not | Logical negation | where not[a = b], where not x > 10 |
null | Is null | where null col1, where null[col1] |
not null | Is not null | where not null col1 |
Scalar functions
| Function | Description | Example |
|---|---|---|
len / length | String length | select len[name], where len[name] > 5 |
upper | Uppercase string | select upper[name], where upper[city] = "ATLANTA" |
lower | Lowercase string | select lower[name] |
abs | Absolute value | select abs[x] |
floor | Numeric floor | select floor[price] |
ceil / ceiling | Numeric ceiling | select ceil[score] |
Summary
| Topic | Detail |
|---|---|
| Query shape | select [cols] [by groups] [where conditions] |
: | name : expression in select and by |
| Spaces in names | col["name"] or col[identifier] |
| Date/datetime accessors | col.date, col.time, col.year, col.month, col.week, col.day, col.dow, col.month_start, col.month_end, col.format["fmt"] |
| String accessors | col.len, col.upper, col.lower, col.starts_with["x"], col.ends_with["x"], col.contains["x"] |
| Literals | Numbers, strings, YYYY.MM.DD, YYYY.MM.DDTHH:MM:SS[.fff...] |
| Coalesce | a^b^c = first non-null of a, b, c |
| Expressions | Right‑to‑left; right side binds tighter; use () to override |
Where , | AND between top‑level conditions |
Where | | OR within one top‑level condition |
Combining , and | | Top-level , = AND; | = OR within a term. e.g. “A, B or C” ⇒ A AND (B OR C). Use () to group. |
Advanced Topics
For help keeping things fast, see Performance Tips.
Performance Tips
Sampling in Analysis Mode
When you use Datui’s Analysis Mode, you can optionally have the application sample from your data rather than analyzing every row. Sampling improves responsiveness and keeps memory usage low when working with very large datasets.
By default, sampling is off: analysis uses the full dataset. To enable sampling for large tables, set a threshold in configuration or on the command line. When enabled, datasets with at least that many rows are analyzed using a representative sample; the r key resamples and the tool shows “(sampled)”.
- Configuration: In
[performance], setsampling_threshold = N(e.g.10000). Omit the setting or leave it unset to keep full-dataset analysis (default). - CLI: Use
--sampling-threshold Nto enable sampling for that run; this overrides the config file. Use--sampling-threshold 0to force full-dataset analysis for that run even if config sets a threshold.
See the Configuration Guide: Performance Settings for details.
Pivot is Eager
In order to determine all column names, pivot operations materialize all affected data in memory, which may increase RAM usage significantly for large tables.
Do as much filtering on the data as possible before pivoting to keep things manageable.
Prefer Directories with --hive
Using a directory with --hive is faster than a glob.
e.g. /path/to/partitioned/ would be faster than /path/to/partitioned/**/*.parquet.
For Developers
- Written in Rust
- Terminal UI made with Ratatui
- Powered by Polars
- Documented using mdBook
- Demo GIFs created with vhs
Install Rust
If you don’t have Rust installed, please see the Rust Installation Instructions.
Workspace and crates
The repo is a Cargo workspace. The root package is the CLI binary; the core logic lives in a library crate:
| Package | Path | Role |
|---|---|---|
| datui | (root) | The datui CLI binary (the one you run). cargo build and cargo run from the root build/run it. |
| datui-lib | crates/datui-lib | Core library (TUI, data handling, config, etc.). |
| datui-cli | crates/datui-cli | Shared CLI definitions (Args, etc.) and the gen_docs binary used by the docs build. |
| datui-pyo3 | crates/datui-pyo3 | Python bindings. See Python Bindings |
From the repo root:
cargo build— build the datui CLI binary (and its dependency, datui-lib).cargo run— run the CLI (e.g.cargo run -- --help).cargo build --workspace— build all workspace packages (root + crates/datui-lib + crates/datui-cli).cargo test --workspace— test all workspace packages.cargo run -p datui-cli --bin gen_docs— run the docs generator (used by the docs build script).
No special config (e.g. default-members or .cargo/config) is needed; the root package is the binary.
Compiling
Compile Datui using cargo:
# Build the CLI binary (default from root)
cargo build

# Build everything (CLI + library + gen_docs)
cargo build --workspace

# Release build of the CLI (what gets installed / packaged)
cargo build --release
- The datui CLI binary is at
target/debug/datuiortarget/release/datui(built from the root package). - The gen_docs binary is built from datui-cli and is used by the documentation build.
- datui-pyo3 is the Python binding crate; it is not a workspace member. See Python Bindings for how to build and test it.
The release build will take significantly longer to compile than debug. But, the release build is faster and has significantly smaller size.
More Resources
- The Setup Script will help you get your environment ready
- Learn how to run the tests
- Run the security checks before touching dependencies or workflows
- Run the fuzzers against the parsers and matchers
- Python Bindings — build, test, and run the Python extension
- Build OS packages (deb, rpm, AUR) with Building Packages
- See the Contributing Guide
Setup Script
The setup process can be automated by running:
python scripts/setup_dev.py
The script will:
- Set up a Python Virtual Environment
- Set up pre-commit hooks
- Generate sample data needed to run the tests
- Configure and build the documentation
Run the script again at any time to update everything.
Running the Tests
Running the tests is done using Cargo’s test command.
# Run all workspace tests (root datui + datui-lib + datui-cli)
cargo test --workspace
From the repo root, cargo test without --workspace runs only the root package (the datui CLI). Use cargo test --workspace to include datui-lib and datui-cli tests (e.g. CI and full local check). The datui-pyo3 crate is not in the workspace; to run Python binding tests, use pytest python/tests/ after installing the package with maturin develop (see Python package).
However, the tests require sample data which are too large to add to the repo. Instead, the data must be generated before the tests can be run.
Generating Sample Data
The quickest path, from a fresh checkout:
./scripts/dev/setup-test-data.sh
cargo test --workspace
That creates .venv, installs scripts/requirements.txt, and generates the
fixtures — the same steps CI runs. It uses uv
when available, otherwise python -m venv. Re-running is safe; --force
regenerates the fixtures from scratch.
Activating the virtualenv is not necessary: the test harness looks for
.venv/bin/python (.venv\Scripts\python.exe on Windows) before falling back to a
system Python.
Without the fixtures, the statistics, distribution-detection and pivot/melt tests fail. The generator requires Polars, NumPy, pyarrow, fastavro and openpyxl.
The rest of this section describes the same steps done by hand.
If you used the Setup Script, the sample data has already been generated. To regenerate the data, see the instructions
The tests will automatically run a Python script to generate the sample files if they do not already exist. However, that script has some dependencies.
To install the dependencies, I recommend following the Python Virtual Environment Setup Instructions from the Contributing section.
Once you have a Python virtual environment set up with the requirements.txt from
the scripts/ directory, and activated it, you’re ready to run the tests for the first time.
# activate the virtual environment if sample data is not already generated
source .venv/bin/activate

# run the tests
cargo test --workspace
The tests will look for the files and run the generation script if they don’t already exist. Having the virtual environment activated before running tests for the first time ensures the automatic generation goes smoothly.
After the files are built you don’t need to have that environment activated anymore to run tests.
Regenerating or Updating the Sample Data
You can run the data generation script yourself:
python scripts/generate_sample_data.py
The data will not be automatically regenerated in the future. Use the script to regenerate the data when necessary.
Security Checks
Reporting a vulnerability, rather than running the checks? See SECURITY.md, which also states what datui does and does not defend against.
Datui runs two automated security checks alongside the usual format and clippy
gates. Both are in the Security workflow, and both can be run locally.
What runs
cargo-deny checks Cargo.lock against the RustSec advisory
database, plus licenses, banned and duplicate crates, and the
registries dependencies come from. It runs against the root workspace and
against crates/datui-pyo3 and fuzz, both of which are excluded from the
workspace and would otherwise never be audited. Configuration is in deny.toml
at the repository root.
Nothing audits the Python dependencies in scripts/. They are development
tooling and never reach a datui user, but an advisory in them still reaches a
contributor’s machine, so a version floor with the advisory ids written beside
it is the current answer.
zizmor analyses the GitHub Actions workflow files for the patterns that let
a pull request steal a secret or poison a build: unpinned actions, over-broad
token permissions, expressions interpolated straight into shell, and cache
poisoning. It fails the build on a high-severity finding and reports everything
else to the Security tab. Suppressions live in zizmor.yml, and each one has to
say what the risk is and what would clear it.
A third check, OpenSSF Scorecard, runs on a schedule in its own workflow. It scores the repository’s supply-chain posture and writes each check to the Security tab with a specific remediation. It never fails a build.
Running them locally
Install the tools once:
cargo install cargo-deny --locked
uv tool install zizmor          # or: pipx install zizmor
Then:
./scripts/code/check_security.sh
When cargo-deny fails
Most advisory failures are cleared by updating the lockfile:
cargo update
cargo deny check advisories
If an advisory cannot be cleared, because the fix is in a version some other
dependency will not accept, add it to the ignore list in deny.toml with two
things written down: why it is acceptable today, and the event that should clear
it. An entry without both is a silenced alarm rather than a decision.
The current entries are all of that shape. The two quick-xml denial-of-service
advisories are the ones worth watching. They used to be reachable whenever datui
opened an .xlsx file, which is untrusted data; calamine 0.36 moved to
quick-xml 0.41 and closed that path. What is left is the copy object_store
uses to parse S3 and GCS responses, which polars pins, so reaching it needs an
object-store endpoint the user chose that answers with hostile XML.
Adding a new action to a workflow
Pin it to a full commit SHA, with the version tag in a trailing comment:
- uses: actions/checkout@fbc6f3992d24b796d5a048ff273f7fcc4a7b6c09 # v5.1.0
A tag is a mutable pointer. Whoever controls the upstream repository can move
v5 to point at anything, and every workflow that trusts the tag will run it on
the next build. A SHA cannot be moved. Dependabot is configured to raise pull
requests when a pinned action has a newer release, so pinning does not mean
going stale.
Resolve the SHA for a tag with:
gh api repos/actions/checkout/tags --jq '.[] | select(.name == "v5.1.0") | .commit.sha'
Fuzzing
Datui fuzzes the hand-written parsers and matchers that run on untrusted input, using
cargo-fuzz and libFuzzer. The targets live in fuzz/.
Everything datui parses arrives from somewhere the user does not fully control: a query typed into the query bar, a config file written by a theme generator, column names that came out of a data file. Serde and Polars handle their own inputs; what is fuzzed here is the code datui wrote itself, which is where the index arithmetic lives.
What is fuzzed
| Target | Surface | What it checks |
|---|---|---|
parse_query | query::parse_query | A tokeniser and recursive-descent parser that slices token vectors by index. Malformed input must return Err, never panic. |
number_format | numfmt::NumberFormat | width_* computes a display width arithmetically, write_* renders into a fixed 64-byte stack buffer and returns the width it produced. The two must agree, and both must equal the characters actually appended. Table columns are sized from these numbers, so a disagreement corrupts the layout instead of failing visibly. |
fuzzy_match | fuzzy::best_match | Returned positions must be valid, strictly ascending character indices into the haystack, one per needle character. The home screen highlights matches by indexing with them. |
glob_match | numfmt::Glob | A backtracking wildcard matcher, checked for hangs and for its wildcard-free fast path agreeing with equality. |
config_parse | config::AppConfig, config::ColorParser | Validation and merging of user TOML, and colour strings that get sliced by byte offset after a byte-length check. |
Three of these check an invariant rather than merely the absence of a panic. A fuzzer that only asks “did it crash” finds far less than one that can also ask “did it produce an answer that contradicts the other implementation of the same thing”.
What the first run found
Two real bugs, both fixed in the change that added these targets, and both kept fixed by the corpus:
- The query parser died on the stack. Parsing is recursive descent, so nesting in
the query became nesting on the stack. Roughly two hundred nested parentheses, or the
same number of leading minus signs, exhausted a worker thread’s stack and killed the
process. Anyone could reach it by pasting into the query bar.
parse_exprnow refuses to nest pastMAX_EXPR_DEPTHand returns an ordinary error. - The colour parser sliced a character in half. It checked that a hex colour was
seven bytes and then indexed at fixed byte offsets.
#followed by a four-byte emoji and two more characters is also seven bytes, so the slice landed mid-character and panicked. It now requires the body to be ASCII before indexing.
Running
Install the tool once:
cargo install cargo-fuzz --locked
Then, from the repository root:
./scripts/code/fuzz.sh list                       # the target names
./scripts/code/fuzz.sh build                      # build them all
./scripts/code/fuzz.sh replay                     # replay the committed corpus and exit
./scripts/code/fuzz.sh run parse_query            # fuzz until interrupted
./scripts/code/fuzz.sh run parse_query -- -max_total_time=60
replay is the quick one. It loads every committed corpus input, runs each once, and
generates nothing new, so it finishes in seconds and never reports something different
on two runs.
What CI does
Every pull request runs replay in the CI workflow. It is a regression gate: it
re-runs the inputs already known to be interesting and fails if one of them starts
crashing again. It does not look for new bugs.
The Nightly workflow runs each target for ten minutes against fresh input, with AddressSanitizer on, as a matrix so one slow target does not consume another’s budget. Crashing inputs are uploaded as build artifacts.
Each target’s corpus is cached between runs, and this matters more than the ten minutes does. Fuzzing is cumulative: reaching a bug often takes a chain of discoveries, where one input gets as far as the tokeniser, a mutation of it reaches the parser, and a mutation of that crashes. Starting from the seed corpus every night caps the search at whatever is reachable in one sitting, so the deep chains never form. With the corpus restored, each night begins where the last one left off.
A cache entry cannot be updated in place, so the key carries the run id and
restore-keys picks up the most recent previous entry. Restore and save are separate
steps because the combined action only writes its cache when the job succeeds, and the
night a target crashes is the night its corpus is most worth keeping. cargo fuzz cmin runs before the
corpus is stored, dropping inputs that no longer reach anything the rest does — otherwise
it grows until restoring it costs more than the fuzzing.
The corpus
fuzz/corpus/ is committed, but it is a seed corpus, not the full coverage corpus.
The two targets that take text are seeded with inputs a person can read: parse_query
from the parser’s own unit tests and the query examples throughout docs/,
config_parse from the TOML blocks in docs/. Anything named regression-* is an
input that once crashed a target, kept so the replay job notices if it ever crashes
again.
The other three take structured input that arbitrary decodes from raw bytes, so a
hand-written seed would mean nothing. Those directories hold a bounded sample of
minimised inputs from a real run, capped at 64 files each.
The cap is deliberate. A few minutes of fuzzing produces thousands of inputs — around 27
MB across 6,900 files even after cargo fuzz cmin — and carrying that in the repository
buys far less than it costs, since nothing in it is reviewable. A run started from these
seeds rediscovers the rest within minutes, and the Nightly workflow uploads whatever it
finds as an artifact.
So: contribute a regression-* file for anything that crashed, and leave the rest to the
fuzzer. If you do want to add coverage seeds, minimise first:
./scripts/code/fuzz.sh cmin parse_query
When a target fails
libFuzzer writes the offending input to fuzz/artifacts/<target>/. Reproduce it by
passing that file instead of a corpus directory:
./scripts/code/fuzz.sh run parse_query fuzz/artifacts/parse_query/crash-<hash>
Fix the bug, then copy the input into fuzz/corpus/<target>/ so the replay job keeps it
fixed. A minimal reproducer usually deserves a unit test next to the code as well.
Sanitizer
The targets build without a sanitizer by default. datui-lib contains no unsafe, so
for this code AddressSanitizer has very little to find that a panic would not already
report: the bugs here are index arithmetic, unbounded recursion and disagreeing width
calculations, and the fuzz profile turns on debug assertions and overflow checks so all
of them trap. It costs about double the build output, 12 GB against 6.0 GB as measured
on Linux, and runs the target itself noticeably slower, so it buys less coverage per
minute of CI.
It is still worth it for a long run, where it can reach the unsafe code inside Polars
and Arrow that these targets feed. Turn it on with:
DATUI_FUZZ_SANITIZER=address ./scripts/code/fuzz.sh run parse_query
The Nightly workflow runs this configuration; the pull request job does not.
Why these run on stable
cargo-fuzz reaches for -Z sanitizer, which is normally nightly-only, and
scripts/code/fuzz.sh sets RUSTC_BOOTSTRAP=1 to allow it on stable instead.
That is a deliberate choice rather than a shortcut. polars-ops has a build script that
enables its own nightly feature whenever it detects a nightly compiler, and that code
path uses core::unicode internals which current nightly no longer exposes. The
dependency tree therefore does not compile on nightly at all, for reasons unrelated to
datui. Building on stable sidesteps that and keeps the fuzzers on the same pinned
toolchain as every other job.
If a future Polars release fixes the nightly path, the flag can be dropped and the
scripts switched to cargo +nightly fuzz.
Adding Configuration Options
When adding new configuration options to datui, follow this process:
Process Overview
Adding a new configuration option requires updates in 7 places:
- Config struct definition
- Default implementation
- Merge logic
- Comment constants (for generated configs)
- Application code usage
- Tests
- Documentation
Step-by-Step Guide
1. Add Field to Config Struct
Add the new field to the appropriate config struct in src/config.rs:
#![allow(unused)]
fn main() {
#[derive(Debug, Clone, Serialize, Deserialize)]
#[serde(default)]
pub struct DisplayConfig {
    pub pages_lookahead: usize,
    pub pages_lookback: usize,
    pub row_numbers: bool,
    pub row_start_index: usize,
    pub font_size: Option<u8>,  // NEW FIELD
}
}
2. Update Default Implementation
Add the default value in the Default trait:
#![allow(unused)]
fn main() {
impl Default for DisplayConfig {
    fn default() -> Self {
        Self {
            pages_lookahead: 3,
            pages_lookback: 3,
            row_numbers: false,
            row_start_index: 1,
            font_size: None,  // NEW: None = use terminal default
        }
    }
}
}
3. Update Merge Logic
Add merge handling in the section’s merge() method:
#![allow(unused)]
fn main() {
impl DisplayConfig {
    pub fn merge(&mut self, other: Self) {
        let default = DisplayConfig::default();
        // ... existing merge logic ...

        // NEW: Merge font_size (Option fields)
        if other.font_size.is_some() {
            self.font_size = other.font_size;
        }
    }
}
}
Merge rules:
- Option fields: If
other.field.is_some(), take the value - Non-Option fields: If
other.field != default.field, take the value
4. Add Config File Comments
The default config file is populated with comments useful to users.
Add comments to the comment constant array right after the struct definition in src/config.rs:
#![allow(unused)]
fn main() {
#[derive(Debug, Clone, Serialize, Deserialize)]
#[serde(default)]
pub struct DisplayConfig {
    pub pages_lookahead: usize,
    pub pages_lookback: usize,
    pub row_numbers: bool,
    pub row_start_index: usize,
    pub font_size: Option<u8>,  // NEW FIELD
}

// Field comments for DisplayConfig
const DISPLAY_COMMENTS: &[(&str, &str)] = &[
    // ... existing fields ...
    (
        "font_size",
        "Font size for terminal display (optional)\nSet to null to use terminal default, or 8-16 for explicit size",
    ),
];
}Note: Comments are defined next to the struct definition. The config template is generated from Rust code defaults, with all fields commented out so users can uncomment to override.
5. Use in Application Code
Access the config value where needed:
#![allow(unused)]
fn main() {
let font_size = config.display.font_size.unwrap_or(terminal_default);
}
Or pass through App if needed globally:
#![allow(unused)]
fn main() {
app.font_size = config.display.font_size;
}
6. Add Tests
Add tests in tests/config_test.rs or tests/config_integration_test.rs:
#![allow(unused)]
fn main() {
#[test]
fn test_font_size_config() {
    let mut config = AppConfig::default();
    config.display.font_size = Some(12);

    assert_eq!(config.display.font_size, Some(12));
    assert!(config.validate().is_ok());
}
}
7. Update Documentation
Update documentation:
- Add to
docs/user-guide/configuration.md - Mention in README.md if it’s a major feature
Note: Configuration comments are defined in comment constants next to struct definitions (e.g., DISPLAY_COMMENTS, PERFORMANCE_COMMENTS) in src/config.rs. The config template is generated programmatically from these constants.
Implementation Checklist
- Field added to config struct
- Default implementation updated
- Merge logic implemented
- Comments added to comment constant (next to struct)
- Used in application code
- Tests added
- Documentation updated
- All tests passing (
cargo test) - No clippy warnings (
cargo clippy) - Code formatted (
cargo fmt)
Best Practices
Choosing Field Types
-
Option fields: Use
Option<T>for optional settings#![allow(unused)] fn main() { pub font_size: Option<u8>, // None = use default } -
Required fields: Use plain types with sensible defaults
#![allow(unused)] fn main() { pub pages_lookahead: usize, // Always has a value } -
Strings: Use
Stringfor text values#![allow(unused)] fn main() { pub delimiter: String, // CSV delimiter character }
Sensible Defaults
Ensure defaults match existing behavior:
#![allow(unused)]
fn main() {
impl Default for DisplayConfig {
    fn default() -> Self {
        Self {
            pages_lookahead: 3,
            pages_lookback: 3,
            row_numbers: false,
            row_start_index: 1,
        }
    }
}
}
Clear Config Comments
Comments in the comment constants should:
- Explain what the option does
- Show valid values or ranges
- Provide examples
- Note any interactions with other settings
Good example:
#![allow(unused)]
fn main() {
const PERFORMANCE_COMMENTS: &[(&str, &str)] = &[
    (
        "sampling_threshold",
        "Optional: when set, datasets with >= this many rows are sampled for analysis.\nWhen unset, full dataset is used. Example: sampling_threshold = 10000",
    ),
];
}
Poor example:
#![allow(unused)]
fn main() {
const PERFORMANCE_COMMENTS: &[(&str, &str)] = &[
    ("sampling_threshold", "Sampling threshold"),
];
}
Validation
Add validation in AppConfig::validate() for constraints:
#![allow(unused)]
fn main() {
fn validate(&self) -> Result<()> {
    // ... existing validation ...

    // Validate new field (when Option, validate only when set)
    if let Some(t) = self.performance.sampling_threshold {
        if t == 0 {
            return Err(eyre!("sampling_threshold must be greater than 0 when set"));
        }
    }

    Ok(())
}
}
Testing Edge Cases
Test important scenarios:
- Missing values (uses default)
- Invalid ranges (validation catches)
- Boundary conditions
- Config merging (CLI overrides config)
- TOML parsing (valid syntax)
Adding Colors to Theme
When adding new colors to the theme system, follow these additional steps:
1. Add to ColorConfig Struct
#![allow(unused)]
fn main() {
#[derive(Debug, Clone, Serialize, Deserialize)]
#[serde(default)]
pub struct ColorConfig {
    // ... existing colors ...
    pub new_color: String,  // NEW
}
}
2. Add to ColorConfig Default
#![allow(unused)]
fn main() {
impl Default for ColorConfig {
    fn default() -> Self {
        Self {
            // ... existing colors ...
            new_color: "cyan".to_string(),  // NEW
        }
    }
}
}
3. Add to Validation
#![allow(unused)]
fn main() {
impl ColorConfig {
    fn validate(&self, parser: &ColorParser) -> Result<()> {
        macro_rules! validate_color {
            ($field:expr, $name:expr) => {
                parser
                    .parse($field)
                    .map_err(|e| eyre!("Invalid color value for '{}': {}", $name, e))?;
            };
        }

        // ... existing validations ...
        validate_color!(&self.new_color, "new_color");  // NEW

        Ok(())
    }
}
}
4. Add to Merge Logic
#![allow(unused)]
fn main() {
impl ColorConfig {
    pub fn merge(&mut self, other: Self) {
        let default = ColorConfig::default();
        // ... existing merge logic ...

        if other.new_color != default.new_color {  // NEW
            self.new_color = other.new_color;
        }
    }
}
}
5. Add to Theme Parsing
#![allow(unused)]
fn main() {
impl Theme {
    pub fn from_config(config: &ThemeConfig) -> Result<Self> {
        let parser = ColorParser::new();
        let mut colors = HashMap::new();

        // ... existing color parsing ...
        colors.insert(
            "new_color".to_string(),
            parser.parse(&config.colors.new_color)?,
        );  // NEW

        Ok(Self { colors })
    }
}
}
6. Add Comments to Comment Constant
#![allow(unused)]
fn main() {
// Field comments for ColorConfig
const COLOR_COMMENTS: &[(&str, &str)] = &[
    // ... existing colors ...
    (
        "new_color",
        "Description of the new color and where it's used",
    ),
];
}Note: Comments are simple text - they’ll be prefixed with # when generating the config. The field itself will appear as # new_color = "cyan" (commented out).
7. Replace Hardcoded Usage
Find and replace hardcoded colors in widgets:
Before:
#![allow(unused)]
fn main() {
Style::default().fg(Color::Cyan)
}
After:
#![allow(unused)]
fn main() {
Style::default().fg(self.color("new_color"))
// or
Style::default().fg(theme.get("new_color"))
}
Color Naming Conventions
- Use descriptive names:
sidebar_bordernotsb - Be specific:
modal_border_activevssidebar_border(modals vs sidebars) - Group logically:
distribution_normal,distribution_skewed,distribution_other - Consider purpose:
text_primary,text_secondary,text_inverse
Common Patterns
Option Field Pattern
#![allow(unused)]
fn main() {
// Config struct
pub struct Config {
    pub optional_field: Option<T>,
}

// Default
impl Default for Config {
    fn default() -> Self {
        Self {
            optional_field: None,  // No default value
        }
    }
}

// Merge
impl Config {
    pub fn merge(&mut self, other: Self) {
        if other.optional_field.is_some() {
            self.optional_field = other.optional_field;
        }
    }
}

// Usage
let value = config.optional_field.unwrap_or(fallback);
}
Required Field Pattern
#![allow(unused)]
fn main() {
// Config struct
pub struct Config {
    pub required_field: usize,
}

// Default
impl Default for Config {
    fn default() -> Self {
        Self {
            required_field: 10,  // Sensible default
        }
    }
}

// Merge
impl Config {
    pub fn merge(&mut self, other: Self) {
        let default = Config::default();
        if other.required_field != default.required_field {
            self.required_field = other.required_field;
        }
    }
}

// Usage
let value = config.required_field;
}
String Field Pattern
#![allow(unused)]
fn main() {
// Config struct
pub struct Config {
    pub mode: String,
}

// Default
impl Default for Config {
    fn default() -> Self {
        Self {
            mode: "auto".to_string(),
        }
    }
}

// Merge
impl Config {
    pub fn merge(&mut self, other: Self) {
        let default = Config::default();
        if other.mode != default.mode {
            self.mode = other.mode;
        }
    }
}

// Validation
fn validate(&self) -> Result<()> {
    match self.mode.as_str() {
        "option1" | "option2" | "option3" => Ok(()),
        _ => Err(eyre!("Invalid mode: {}. Must be one of: option1, option2, option3", self.mode))
    }
}
}
Resources
- See
src/config.rsfor existing implementations and comment constants (e.g.,PERFORMANCE_COMMENTS,DISPLAY_COMMENTS) - See
tests/config_test.rsfor test examples - Run
datui --generate-configto see the generated config template (all fields commented out)
Questions?
If you’re unsure about:
- Which config section to use: Look at similar settings in existing config
- Merge logic: Follow the patterns in existing merge implementations
- Validation: Add validation if there are constraints on the value
- Testing: Look at existing tests for similar config types
Documentation
Datui uses mdBook to build static documentation web pages from markdown files. The published docs site (GitHub Pages) contains tagged releases only; docs are built and deployed when you push a version tag (see Release workflow).
The documentation markdown files live in the docs subdirectory.
Prerequisites
-
mdbook — required for all doc builds:
cargo install mdbookIf you used the Setup Script, mdbook may already be installed. The build scripts look for it in
PATHor~/.cargo/bin/. -
Python 3 + scripts/requirements.txt — required only when building docs for the current branch (e.g.
main) or when generating command-line options. Tag builds use the committedcommand-line-options.mdfor that tag.
Build documentation locally
Build all tagged versions (matches production)
This builds docs for every v* tag and rebuilds the index. It skips any tag whose book/<tag>/ was already built for the same git SHA, so re-running only rebuilds new or changed tags.
python3 scripts/docs/build_all_docs_local.py
Output goes to book/. At the end you can start a local HTTP server to browse, or open book/index.html in a browser.
To force a full rebuild (e.g. after changing the build script or cleaning up):
rm -rf book && python3 scripts/docs/build_all_docs_local.py
Build a single version
Useful for quick iteration on one tag or to preview the current branch:
# Build one tag (e.g. v0.2.22)
python3 scripts/docs/build_single_version_docs.py v0.2.22

# Build current branch (e.g. main) — output in book/main/
python3 scripts/docs/build_single_version_docs.py main
A single-version build does not update the index. The index only lists tagged versions, so book/main/ will not appear there; open book/main/index.html directly to preview.
Generated reference: command-line options
docs/reference/command-line-options.md is generated from the application’s Clap definitions. Do not edit it manually.
The doc build copies docs/ into a temp directory, generates the CLI options into that copy (for non-tag builds), then runs mdbook from the temp tree. Tag builds use the committed file for that tag.
To generate the options file on demand:
python3 scripts/docs/generate_command_line_options.py              # print to terminal
python3 scripts/docs/generate_command_line_options.py -o path.md   # write to path
The release workflow and gen_docs use this script when building docs.
Check documentation links
Use lychee to check for broken links:
cargo install lychee
./scripts/docs/check_doc_links.sh [--build] [--online] [PATH]
--build— Build docs formainfirst (build_single_version_docs.py main), then check that tree.--online— Check external URLs as well (default is offline, internal links only).PATH— Directory to check (default:book/main). Use a tag directory after building all docs, e.g.book/v0.2.22.
Examples:
./scripts/docs/check_doc_links.sh --build              # build main, then check book/main
python3 scripts/docs/build_all_docs_local.py && \
  ./scripts/docs/check_doc_links.sh book/v0.2.22         # check a tag after full build
The script exits with a non-zero code if any broken links are found.
Release workflow
Docs are built and deployed only when a version tag (v*) is pushed. The release workflow:
- Computes a cache key from the set of all
v*tags and their current SHAs. The key changes when a tag is added or when a tag’s SHA changes (e.g. force-move). - Restores the
book/directory from cache (if any) so previous tag builds can be reused. - For each tag, builds docs only if
book/<tag>/.built_shais missing or does not match the tag’s current SHA. Otherwise the cached build for that tag is skipped. - Runs rebuild_index.py to regenerate the index from the tag directories.
- Prepares the Pages artifact by copying
bookto a deploy tree and removing cache metadata (.built_sha), then uploads that tree to GitHub Pages.
So the first run (or after cache eviction) builds all tags; later runs only build new or changed tags. This keeps release job time down as the number of tags grows.
Scripts involved:
- build_single_version_docs.py — Builds one version (tag or branch). Used by CI and by
build_all_docs_local.py. - build_all_docs_local.py — Builds all tags locally with the same skip-if-built logic for fast re-runs.
- rebuild_index.py — Scans
book/forv*version dirs and generatesbook/index.htmlfromindex.html.j2.
Demos
The Datui demo animations are created using vhs, which lets you script and record keystrokes to a terminal app.
Prerequisites
VHS
JetBrainsMono Nerd Font
- Get it from nerdfonts.com and install it manually
- Get it from your distribution’s package manager
- Arch Linux
- Other distributions may have their own packages
Define Tapes
The vhs application uses .tape files to script keystrokes. See Datui’s here.
Only tape files matching the {number}-{name}.tape format (e.g. 01-basic-navigation.tape)
are included when generating all demos.
The home-screen demo records against a fixture
Every other tape opens a file it names. The home screen instead shows what is around you — recents, the working directory, configured directories, and the desktop’s recently-used list — so recording it on a developer’s machine would put that machine’s contents on screen. That is a privacy problem before it is anything else: the desktop’s list in particular holds whatever you last opened anywhere, which is regularly something you would not publish.
So 12-home-screen.tape records against a fixture, built by
make-home-fixture.py, which the generator runs first:
- its own workspace of generated Parquet under
/tmp/datui-demo, laid out like a real research tree — hive-partitioned by year, with related datasets — because the home screen’s whole point is what it can tell you about data before you open it, and that needs data with a shape; - its own
DATUI_CACHE_DIR, soRecentis seeded rather than inherited; - its own
XDG_CONFIG_HOMEholding a config withuse_desktop_recents = false, which is the line that matters: that list is the one input which can put a file from anywhere on the machine into the recording.
The tape exports those two variables itself, with Hide … Show around them, because
VHS 0.11 has no Set Env.
The upshot is that regenerating this GIF gives the same result on any checkout, and shows nothing belonging to whoever ran it.
Generating the Animations
Run generate_demos.py to use vhs to generate an animated gif file for each
matching tape. The script builds the debug binary, then runs VHS in parallel (one process per
tape by default, using all available cores).
The script runs a debug build and uses that binary when creating the demos.
# Generate all demos (parallel, uses all cores)
python scripts/demos/generate_demos.py
Or if the script is executable:
scripts/demos/generate_demos.py
Useful command-line options
| Option | Short | Description |
|---|---|---|
--number N | -N | Generate only the demo with this number (e.g. -N 2 for 02-querying.tape). |
--workers N | -n | Number of parallel workers (default: all available cores). |
Examples:
# Generate only the second demo
python scripts/demos/generate_demos.py --number 2

# Generate all demos using 4 worker processes
python scripts/demos/generate_demos.py -n 4
The animations will be placed in the demos directory. A percentage bar shows progress as each tape finishes.
During the creation of the documentation, these animations are copied into a
demos/subdirectory of the generated site. From there, the files may be referenced from within the docs.
Contributing
Thank you for your interest in contributing to Datui!
After cloning the repo, follow the Setup instructions below to get started.
Setup
The entire setup process can be automated with the Setup Script. The sections below describe the manual steps.
Python Virtual Environment
There are Python scripts in the /scripts directory that are
used to do things like build test data, documentation, and demo gifs.
Setting up a virtual environment with dependencies for these scripts will ensure you can run them all.
A common convention is to create a virtual environment in the .venv/ directory
of the repository. The .gitignore is set up to ignore this location
so that files there aren’t added by mistake.
python -m venv .venv
Then activate the virtual environment.
source .venv/bin/activate
Once activated, install dependencies used to run the availble Python scripts.
pip install -r scripts/requirements.txt
You’re now ready to run the tests.
Pre-commit Hooks
To encourage consistency and quality, the CI build checks the source code of the application for formatting and linter warnings.
This project uses pre-commit to manage git pre-commit hooks which automatically run the same code quality checks in your repository before commits are made.
Installing Pre-commit and Hooks
If you used the Setup Script, the pre-commit hooks are already installed.
-
Install pre-commit:
If you set up a Python virtual environment using the instructions above then you already have everything you need. Activate it and skip this step.
Otherwise, install
pre-commitusing your desired method.# Using pip pip install pre-commit # Or using homebrew (macOS) brew install pre-commit # Or using conda conda install -c conda-forge pre-commit -
Install the git hooks:
pre-commit installThis installs the hooks into
.git/hooks/so they run automatically on commit.Note: You only need the
pre-commitcommand accessible when you need to use it to manually run or update the hooks. Once installed into your repo, the hooks themselves do not requirepre-commit.See the
pre-commitdocumentation for more information about its features.
The following hooks are configured:
-
cargo-fmt: Automatically formats Rust code with
cargo fmt- If code needs formatting, it will be formatted and the commit will fail
- Stage the formatted changes and commit again
-
cargo-clippy: Runs
cargo clippy --all-targets -- -D warnings- Fails if clippy finds any warnings
- Fix them and commit again
Hooks run automatically when you git commit. If any hook fails, the commit is aborted.
Running Hooks
Run all hooks manually:
pre-commit run --all-files
Run a specific hook:
pre-commit run cargo-fmt --all-files
pre-commit run cargo-clippy --all-files
Skipping Hooks
If you need to skip hooks for a specific commit (not recommended):
git commit --no-verify -m "Emergency fix"
Updating hooks
Update hook versions and configurations:
pre-commit autoupdate
Troubleshooting
Hook not running?
- Make sure you ran
pre-commit install - Check
.git/hooks/pre-commitexists
Hooks too slow?
- Only changed files are checked by default
- Use
SKIP=hook-name git committo skip specific hooks
Adding Configuration Options
For detailed instructions on adding new configuration options to datui, see the dedicated Guide to Adding Configuration Options.
Building Packages
Datui can be packaged for Debian/Ubuntu (.deb), Fedora/RHEL (.rpm), and Arch Linux (AUR).
Prerequisites
- Rust: Install via rustup
- Python 3: For running the build script
- Cargo packaging tools: Install as needed:
cargo install cargo-deb           # For .deb packages
cargo install cargo-generate-rpm  # For .rpm packages
cargo install cargo-aur           # For AUR packages
Building Packages
Run from the repository root:
# Build a .deb package (Debian/Ubuntu)
python3 scripts/packaging/build_package.py deb

# Build a .rpm package (Fedora/RHEL)
python3 scripts/packaging/build_package.py rpm

# Build AUR package (Arch Linux)
python3 scripts/packaging/build_package.py aur
The script automatically:
- Runs
cargo build --release - Generates and compresses the manpage
- Invokes the appropriate cargo packaging tool
- Reports the output file locations
Options
--no-build: Skipcargo build --release(use when artifacts already exist)--repo-root PATH: Specify repository root (default: auto-detected via git)
# Example: build .deb without rebuilding (artifacts must exist)
python3 scripts/packaging/build_package.py deb --no-build
License and metadata
All packages include the MIT license as required:
- deb:
[package.metadata.deb]setslicense-file = ["LICENSE", "0"]; cargo-deb installs it in the package. - rpm:
[[package.metadata.generate-rpm.assets]]includesLICENSEat/usr/share/licenses/datui/LICENSE. - aur:
[package.metadata.aur]filesincludes["LICENSE", "/usr/share/licenses/datui/LICENSE"]. - desktop entry:
scripts/packaging/datui.desktopinstalls to/usr/share/applications/datui.desktopin all three package formats, putting datui in desktop launchers.tests/desktop_entry_test.rsvalidates the file and checks it is wired into every packager. - Python wheel:
python/pyproject.tomluseslicense = { file = "LICENSE" }andsdist-include = ["LICENSE"]. CI and release workflows copy the rootLICENSEintopython/LICENSE.
Output Locations
| Package | Output Directory | Example Filename |
|---|---|---|
| deb | target/debian/ | datui_0.2.11-dev-1_amd64.deb |
| rpm | target/generate-rpm/ | datui-0.2.11-dev-1.x86_64.rpm |
| aur | target/cargo-aur/ | PKGBUILD, datui-0.2.11-dev-x86_64.tar.gz |
CI and Releases
The same script is used in GitHub Actions:
- CI (
ci.yml): Builds and uploads dev packages (.deb,.rpm,.tar.gz) on push tomain - Release (
release.yml): Attaches.deb,.rpm, and Arch.tar.gzto GitHub releases
Release notes
release.yml composes the release body before creating the release. It uses
release-notes/v<version>.md when that file is committed, and otherwise
generates a body from the commit subjects since the previous tag. The body is
therefore never empty, and hand-written notes are always optional.
The timing is the point. publish-packages.yml starts about a minute after the
release is created, and komac copies the release body into the winget manifest
as ReleaseNotes. Notes typed onto the release page afterwards fix what people
read on GitHub and nothing else, because winget already has whatever the body
said. Version 0.3.1 shipped to winget with no release notes that way.
To write notes for a release, run python scripts/bump_version.py notes and
commit the file with the release. tests/release_notes_test.rs checks the
wiring in CI, which runs on the release commit before the tag is pushed, and the
winget job refuses to run komac against an empty release body. See
release-notes/README.md.
Arch Linux Installation
Arch users can install from the release tarball:
# Install runtime dependency (required for terminal rendering)
sudo pacman -S fontconfig
# Download the tarball from a release, then extract and install
tar xf datui-X.Y.Z-x86_64.tar.gz
sudo install -Dm755 datui /usr/bin/datui
sudo install -Dm644 target/release/datui.1.gz /usr/share/man/man1/datui.1.gz
sudo install -Dm644 LICENSE /usr/share/licenses/datui/LICENSE
Or use the included PKGBUILD with makepkg (it declares fontconfig as a dependency).
AUR Release Workflow
To update the AUR package when you release a new version:
-
Checkout the release tag and build the AUR package:
git checkout vX.Y.Z cargo build --release --locked python3 scripts/packaging/build_package.py aur --no-build -
Generate
.SRCINFOand copy to your AUR repo:cd target/cargo-aur makepkg --printsrcinfo > .SRCINFO cp PKGBUILD .SRCINFO /path/to/aur-datui-bin/ -
Commit and push to the AUR:
cd /path/to/aur-datui-bin
git add PKGBUILD .SRCINFO
git commit -m "Upstream update: X.Y.Z"
git push
Use stable release tags only (e.g. v0.2.11); the AUR package fetches the tarball from the GitHub release. Dev builds are available from the dev release tag.
Automated AUR updates (GitHub Actions)
The release workflow can push PKGBUILD and .SRCINFO to the AUR automatically when you push a version tag. It publishes to the datui-bin AUR package (per AUR convention for pre-built binaries). It uses KSXGitHub/github-actions-deploy-aur: the action clones the AUR repo, copies our PKGBUILD and tarball, runs makepkg --printsrcinfo > .SRCINFO, then commits and pushes via SSH.
Required repository secrets (Settings → Secrets and variables → Actions):
| Secret | Description |
|---|---|
AUR_SSH_PRIVATE_KEY | Your SSH private key. Add the matching public key to your AUR account (My Account → SSH Public Key). |
AUR_USERNAME | Your AUR account name (used as git commit author). |
AUR_EMAIL | Email for the AUR git commit (can be a noreply address). |
If these secrets are not set, the “Publish to AUR” step will fail. To disable automated AUR updates, remove or comment out that step in .github/workflows/release.yml.
WinGet releases
The publish-winget job in .github/workflows/publish-packages.yml uses
winget-releaser, which drives
komac to open a manifest PR against
microsoft/winget-pkgs from our fork at
derekwisong/winget-pkgs.
Required repository secret:
| Secret | Description |
|---|---|
WINGET_TOKEN | Classic PAT with public_repo scope. Fine-grained PATs do not work — they cannot open a cross-fork PR against a repo you don’t own. |
At least one version of derekwisong.datui must already exist in winget-pkgs; the
action refuses to create a brand-new package.
Recovering from “does not have the correct permissions to execute UpdateRef”
Before opening the PR, komac fast-forwards our fork from upstream. GitHub blocks any
ref update that touches .github/workflows/ unless the token carries workflow
scope, and upstream winget-pkgs edits its own workflows every few weeks — so the sync
fails once enough time has passed since the last release. The error names a
permissions problem, but WINGET_TOKEN is fine; do not rotate it.
We can’t just add the scope: GitHub’s classic-PAT UI force-selects full repo
(private repos included) whenever workflow is checked.
The preflight step attempts the sync itself and, when blocked, fails fast with these steps in the job log:
- Open https://github.com/derekwisong/winget-pkgs and click Sync fork → Update branch. A browser session has permissions the PAT doesn’t.
- Re-run just the failed job:
gh run rerun <run-id> --failed - Confirm the PR opened:
gh pr list --repo microsoft/winget-pkgs --author derekwisong
Being a few commits behind upstream at job start is harmless — winget-pkgs merges manifest PRs constantly and those never touch workflow files.
If this becomes a recurring nuisance, the durable fix is a dedicated machine account
that owns the fork and holds a repo + workflow PAT (full repo scope is harmless
on an account with no private repos), wired up via the action’s fork-user input.
More Information
For detailed information about packaging metadata, policies, and AUR submission, see plans/packaging-deb-rpm-aur-plan.md.
Python Bindings
The datui-pyo3 crate and the datui Python package let you open the datui TUI from Python with a Polars LazyFrame or DataFrame (e.g. datui.view(lf) or datui.view(df)). Data is passed via binary (from LazyFrame.serialize()). Use a Polars Python version built with the same Rust Polars as this extension (e.g. polars 1.35.x uses Rust 0.51). The crate lives at crates/datui-pyo3 and is excluded from the Cargo workspace; it is built with maturin from the python/ directory.
Summary
| Task | Command |
|---|---|
| Build and install (development) | cd python && maturin develop |
| Run Python tests | pytest python/tests/ -v |
| Use in Python | import datui; datui.view(lf) or datui.view(df) |
Use a virtual environment so the extension and package are installed into that env.
Virtual environment
Use a venv so the datui package and its dependencies (e.g. polars) are isolated.
The Setup Script (scripts/setup_dev.py) creates .venv and installs scripts/requirements.txt
which contain all the requirements here.
Create and activate (from repo root):
python -m venv .venv
source .venv/bin/activate
Install build and test dependencies in the venv:
pip install --upgrade pip
pip install maturin "polars>=0.20" "pytest>=7.0"
Building locally
Build and install the full datui package (Python wrapper + Rust extension) into the current environment. From the python/ directory:
# Activate venv first (see above)
cd python
maturin develop
-
Debug (default): faster to compile, larger binary. Omit
--release. -
Release: add
--releasefor a smaller, faster binary:maturin develop --release
You need Rust and Python development headers (e.g. python3-dev on Debian/Ubuntu). Maturin will use the Python that runs maturin (or the one in your activated venv). From the repo root you can run cd python && maturin develop.
Testing
With the package installed in your venv (after cd python && maturin develop), run the Python tests from the repo root:
pytest python/tests/ -v
Tests check that the module imports, that view, view_from_json, and run_cli exist, and that invalid inputs raise (they do not run the TUI).
Running
In Python (view a LazyFrame):
import polars as pl
import datui

lf = pl.scan_csv("data.csv")
datui.view(lf)   # Opens TUI; press q to exit
CLI from the same env:
If you built the datui binary (cargo build (from repo root)) and it’s on your PATH, the datui console script (from pip / maturin) will use it. Otherwise install the CLI separately (e.g. from GitHub releases or your system package manager).
More
- User-facing install and usage: python/README.md in the repo.
- PyPI package:
pip install datui
PyPI Deployment
GitHub actions publish the Python package as part of the release workflow.
Trigger
- Release workflow (
.github/workflows/release.yml) runs on push of a tagv*(e.g.v0.2.31). - Prerequisite: CI must have passed for that commit. Recommended: push to
main→ wait for CI → then create and push the tag.
What gets built
Wheels are built with maturin from python/: the Rust extension comes from crates/datui-pyo3, and the release binary is copied into python/datui_bin/ before maturin build so the wheel ships a bundled datui CLI.
PyPI
- Publish step:
twine uploaddelivers the wheels to PyPI (Linux and Windows wheels). - Version: Keep
python/pyproject.tomlversion in sync with the release;scripts/bump_version.py releaseupdates the root crate and the Python package.