Pivot and melt
p reshapes the table: Pivot turns values into columns, Melt turns columns into rows. It reshapes the rows the query and filters leave.
p opens the builder full screen: the form on the left, a live preview of the result on the right. Below 100 columns the preview sits under the form.
| Preview line | Says |
|---|---|
| Input | The rows the preview ran over: all 376 rows, or the first 1,000 rows of 1,939,184 of a larger view, unsorted when the view is sorted (a small sorted view is read in its order) |
| Result | The shape, rows × columns. ? is what the first rows cannot tell; a pivot’s columns read 12+ until applied |
▲ | A pivot with 100 or more new columns, or why the reshape fails on these rows |
Under them, the first rows of the result, typed and colored as the table draws them. Each change to the form runs the preview again in the background; Enter applies the reshape to the whole view.
Pivot
Open US baby names (1880-2017) from Example datasets: 1.9 million rows
of year, sex, name, n and prop. Keep three girls’ names:
SELECT year, name, n FROM df WHERE sex = 'F' AND name IN ('Emma', 'Jennifer', 'Olivia')
376 rows. Press p and choose these settings on Pivot:
| Setting | Value | Meaning |
|---|---|---|
| Index | year | One row per year |
| Columns | name | One output column per name |
| Values | n | The count to put in each cell |
| Aggregate | last | There is one value per year and name, so any aggregate keeps it |
Use ↓ to move through settings. Space opens a column picker; type to narrow, Space to select and Enter to close it. ← → step Aggregate.
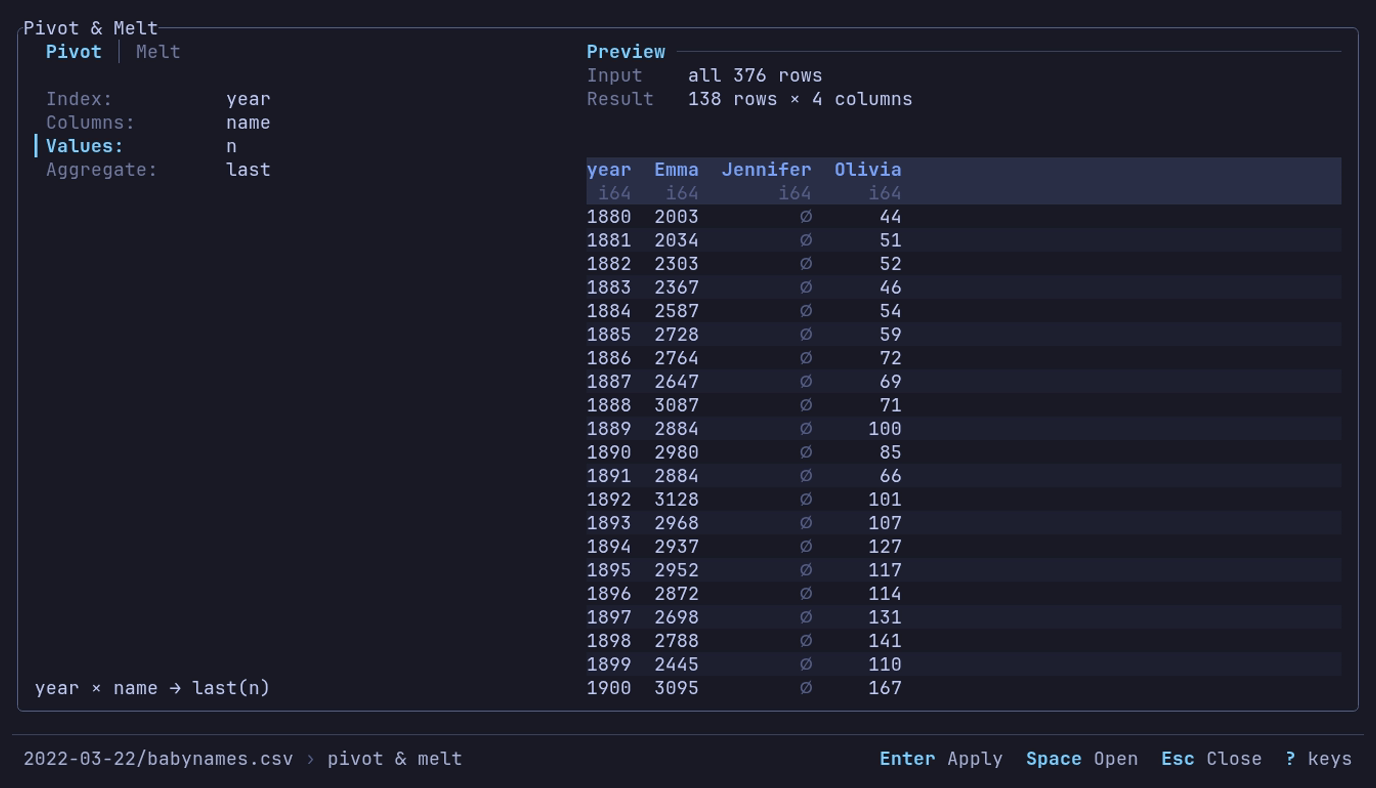
One column per name, a row per year? The preview says 138 rows × 4 columns
before anything is applied. p, then Index year,
Columns name, Values n.
The status footer under the builder reads <dataset> › pivot & melt and names the keys
that act on the focused field, here Enter Apply Space Open Esc Close.
Press Enter to apply.
The result has 138 rows, one per year, and the columns year, Emma,
Jennifer and Olivia. A year with no count for a name is null: Jennifer is
∅ before 1916, and in 1917 and 1918. Chart it as three lines; see
the examples.
Output columns are sorted alphabetically. Pivot reads the rows once, in the background, and keeps one value per index and column pair in memory; filter large datasets first. A pivot that would make more than 10,000 columns is refused, with the count it would make; so is a view whose pivot would.
A date or datetime past the calendar’s range, such as a sentinel of
i64::MIN + 1 microseconds, names its column by its stored number, as the
table shows it: -9223372036854775807 us since 1970-01-01 UTC.
Choose an aggregate
Available functions are last (default), first, min, max, avg, med,
std and count. String values support only first and last.
Those two functions are positional and retain nulls. After sorting with nulls
last, last returns null for any group ending in a null.
Count with a pivot
count turns rows into tallies. On Space launches (1957-2018), with no
query, press p and set:
| Setting | Value |
|---|---|
| Index | launch_year |
| Columns | category |
| Values | tag |
| Aggregate | count |
62 rows of launches per year: O for those that reached orbit, F for
failures. 1967 has 127 and 12. Rows come in the order the years first appear
in the file; a line chart draws them in X order regardless.
Melt
To turn the names pivot back into rows, press p, select Melt, and set:
| Setting | Value |
|---|---|
| Index | year |
| Strategy | All except index |
| Variable name | name |
| Value name | n |
The name fields start as variable and value, selected: typing replaces
them. Apply with Enter. The result has 414
rows with columns year, name and n: the 376 counts, plus a null for each
of the 38 years Jennifer has none.
Other strategies select columns by regex (By pattern), data type (By type) or an Explicit list. The form shows how many columns match, and the preview the rows they make, before it runs.
Melting dates together with text makes the values text. A date past the calendar’s range becomes its stored number, as in a pivot.
Press R from the table to clear the reshape and other view changes.
Keys
The builder takes the keys every dialog takes. It opens on its first row, Pivot or Melt.
| Key | Action |
|---|---|
| ↓ ↑ or Tab Shift+Tab | Move between the rows |
| ← → | On the first row, switch Pivot and Melt; on Aggregate, Strategy or Type, the previous or next value; on Columns or Values, the previous or next column; in a text field, move the cursor |
| Space | On a choice, its next value; on a column row, open its picker (type to narrow) |
| ↑ ↓ in the picker | Move; Space chooses, or toggles where several can be chosen |
| Enter | In the picker, choose; otherwise apply, from anywhere |
| Esc | Stop a pivot being computed and keep the builder; close the picker alone, undoing the toggles made since it opened (Enter keeps them); otherwise close without applying |
| ? | Help |
Views
A view saved after a pivot or melt stores the reshape and the query, filters and sort it ran over. When it is applied, the order is that query, filters and sort, the pivot or melt, then any SQL, filters and sort on its result, then column order.