Quick start
Open public penguin measurements from the built-in catalog, compare three species, chart them, and copy the result. Install datui first.
1. Open the data
datui
Type penguins to narrow the home screen, select Palmer penguins under
Example datasets, and press Enter. A catalog file this small
downloads without a question.
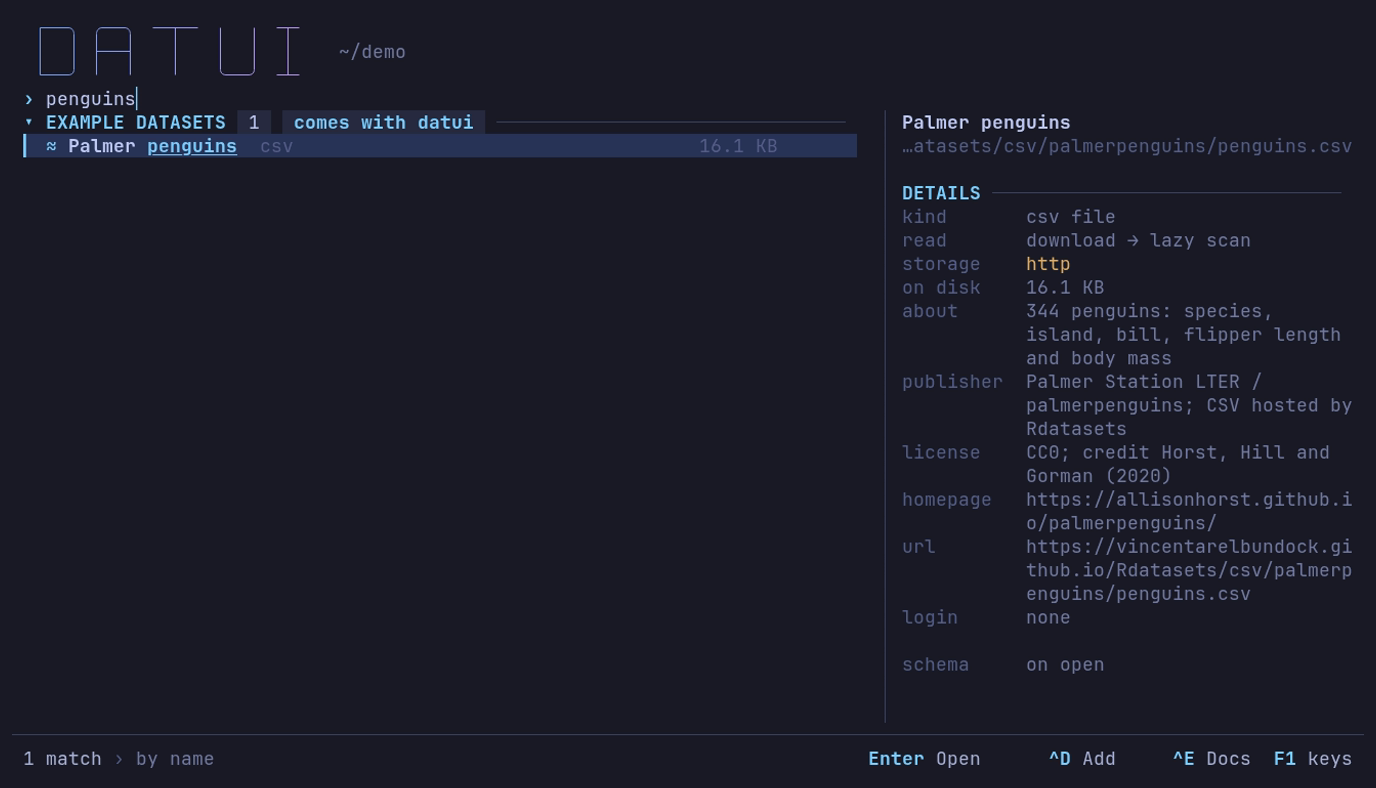
Type penguins: one match, its details beside it. Enter opens it.
The table has 344 penguins. Empty fields in the file are null, shown as ∅;
rownames is the row number the host, Rdatasets, adds. The data is CC0, from
Palmer Station LTER; credit Horst, Hill and Gorman (2020).
To skip the home screen, give the URL; datui asks before it downloads a URL you type, and Enter says yes:
datui https://vincentarelbundock.github.io/Rdatasets/csv/palmerpenguins/penguins.csv
| Key | Action |
|---|---|
| Arrow keys or h j k l | Move around |
| PgUp PgDn | Move a page |
| Wheel, click | Scroll; put the cursor on a cell. A double-click inspects the row |
| i | Info panel: columns and file details |
| ? | This screen’s keys; Enter on one runs it |
| Esc | Close a panel or go back |
| q | Back to the home screen; quits when the table was opened from the shell |
| Ctrl+Q | Quit |
2. Group by species
Which species is heaviest? Press :; the command line opens at
sql:. Type this, then press Enter:
SELECT species, AVG(body_mass_g) AS mean_mass_g, COUNT(*) AS penguins
FROM df
GROUP BY species
ORDER BY mean_mass_g DESC
Type it on one line, or press Alt+Enter for a new line.
| species | mean_mass_g | penguins |
|---|---|---|
| Gentoo | 5076.01626 | 124 |
| Chinstrap | 3733.088235 | 68 |
| Adelie | 3700.662252 | 152 |
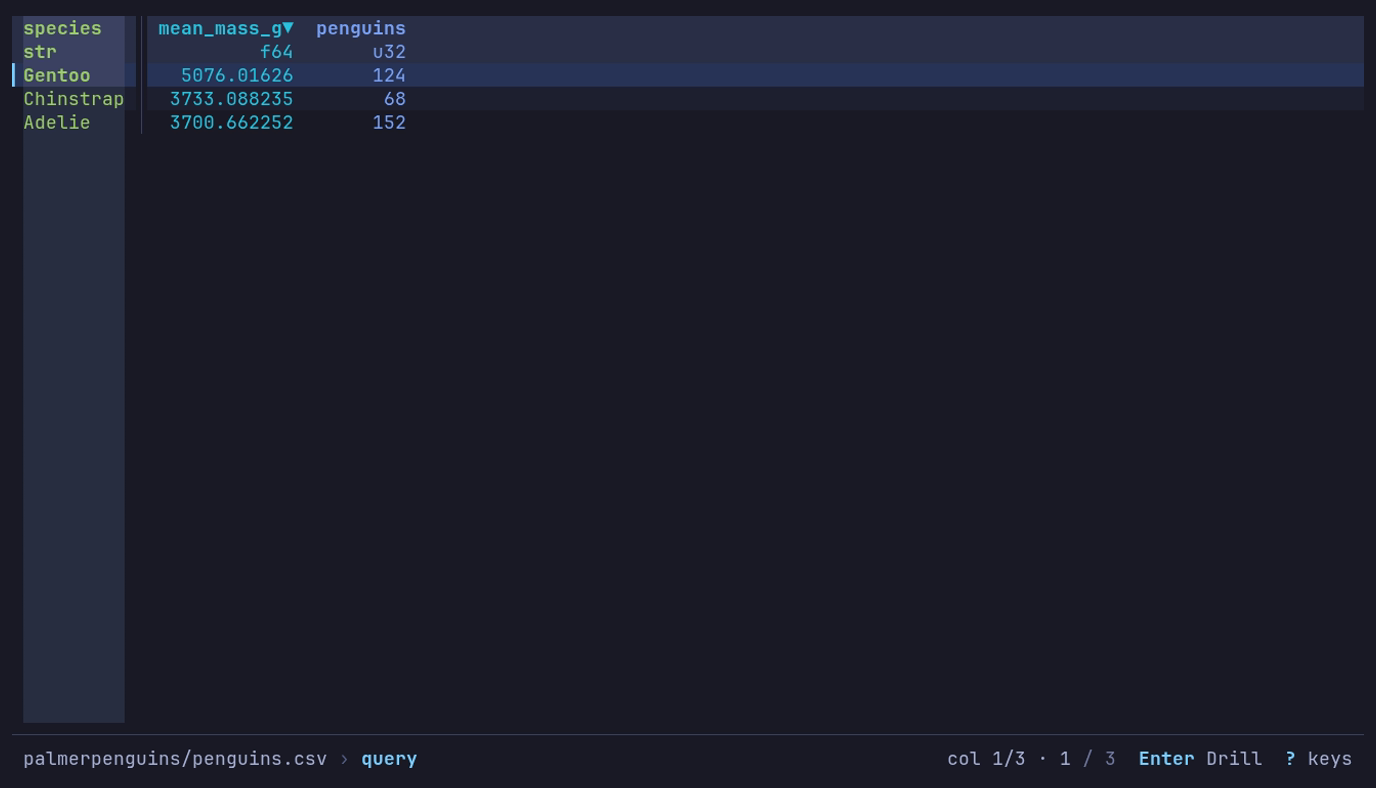
Which species is heaviest? Gentoo, 5,076 g on average over 124 penguins. :, the query, Enter.
AVG skips the two penguins with no mass; COUNT(*) counts every row. The
table is named df. Press Enter on Gentoo to see its 124 penguins,
and Esc to come back.
The same summary is one line in q, a subset of q that evaluates right
to left. Press :, then Ctrl+T for q::
select mean_mass_g: avg body_mass_g by species
A new query starts a fresh view, clearing sidebar filters and sort. See querying for more SQL and q.
3. Chart the measurements
Do heavier penguins have longer flippers? Press R to return to the
original rows, put the column cursor on body_mass_g (g, type
body_mass_g, Enter), then press c for a chart and
2 for Scatter. Y starts on the cursor’s column.
| Shelf | Choose |
|---|---|
| Type | Scatter (2) |
| X | flipper_length_mm |
| Y | body_mass_g |
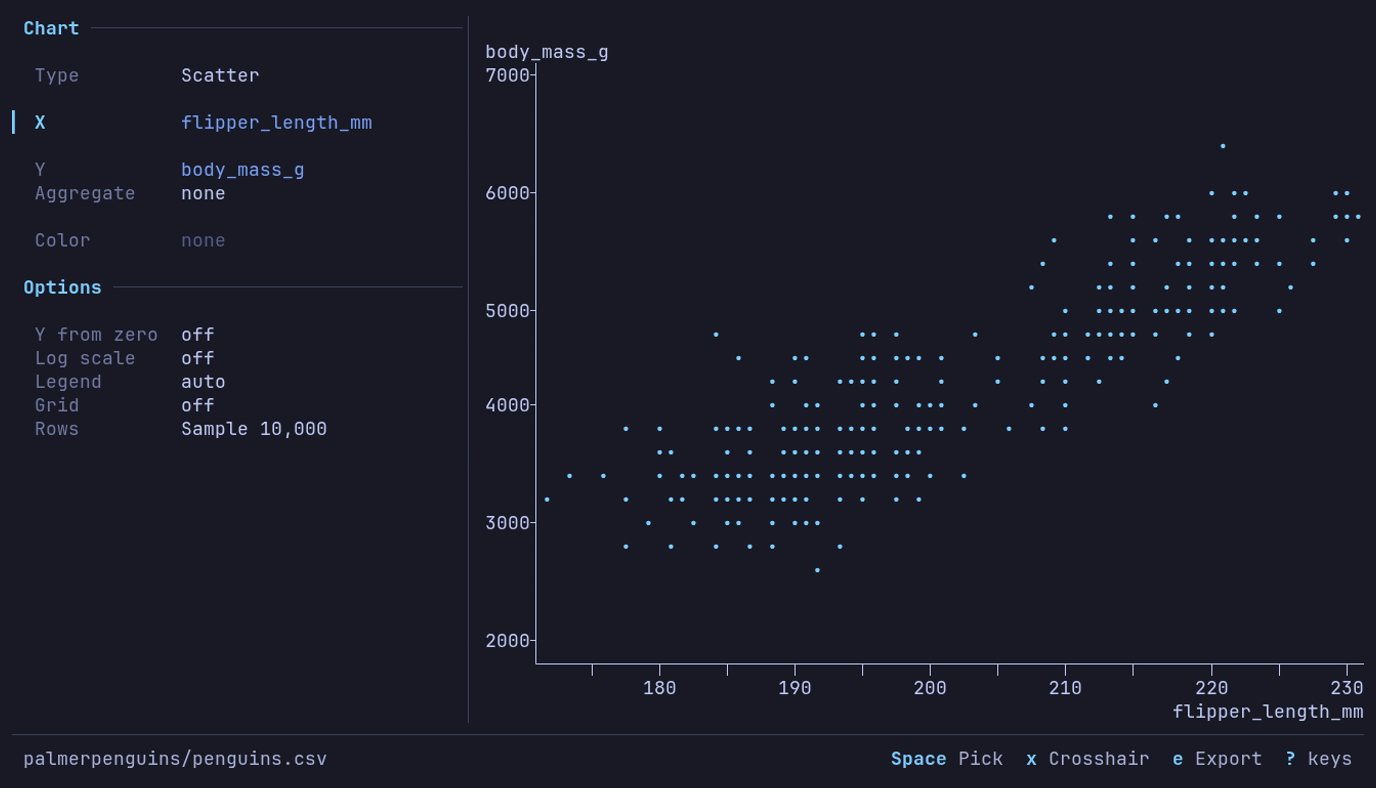
Do heavier penguins have longer flippers? Yes. c 2, then
X flipper_length_mm.
↓ ↑ move between rows of the panel; Space on X opens its picker. Type part of the name and press Enter. The two penguins with no measurements are left out.
Now press 3 for Bar, choose species for X, and on
Aggregate press → for count: Adelie 152, Gentoo 124,
Chinstrap 68.
Press e in the chart to export a PNG, SVG or PDF. Press Esc to return to the table. More chart options.
4. Copy or export
Run the species summary again, then choose an output:
| Do this | How |
|---|---|
| Copy the summary into a note | y → Scope Table → Format Markdown → Enter |
| Export a data file | e → type penguin-summary.csv in Path → Enter |
| Reuse the query on another file | v → s to save a view |
Export and copy use the current rows and columns. They do not overwrite the input file unless you export to that path and confirm.
Use your own data
Replace <FILE>, <DIRECTORY> and <BUCKET>/<PREFIX> with your own:
datui <FILE>
datui <DIRECTORY>/
datui s3://<BUCKET>/<PREFIX>/
datui alone starts at the home screen.
Next: open files and directories, formats, cloud access, or all keyboard shortcuts.